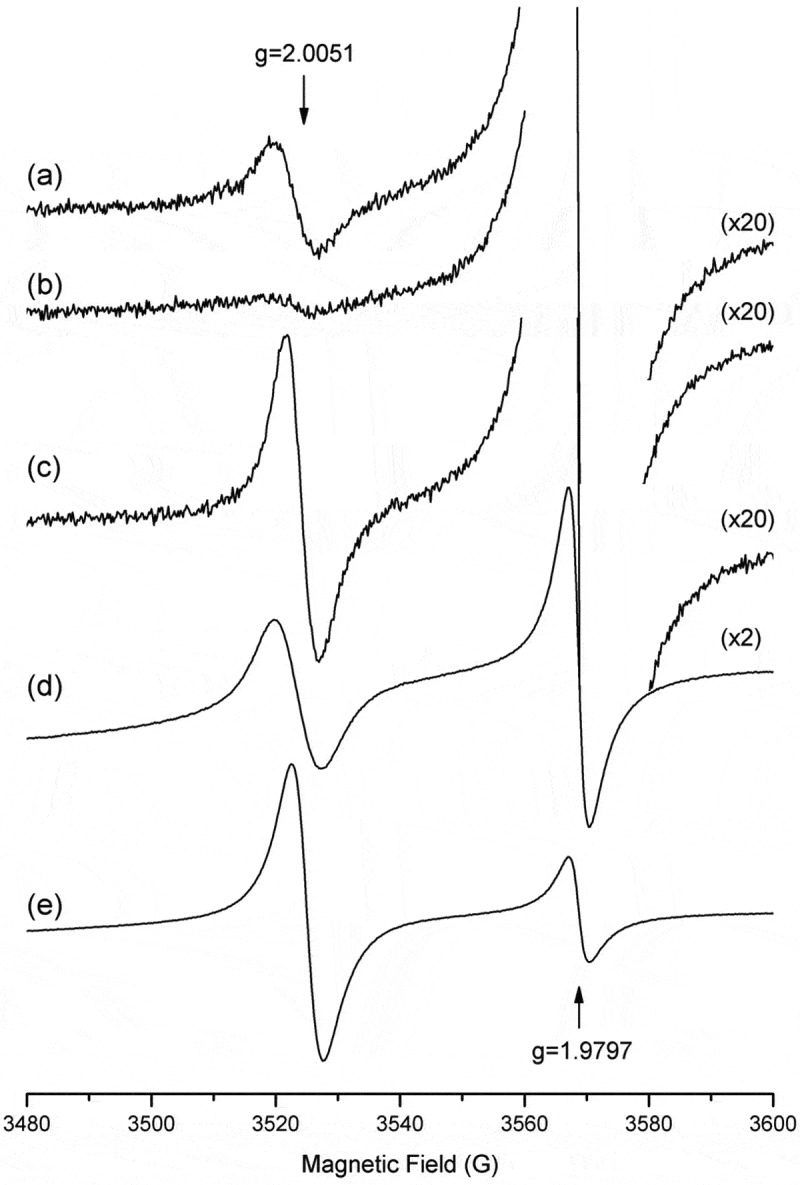
Figure 3.

EPR spectra. a) Colony of D. flagrans in SDA medium, b) D. flagrans treated with 160 μg of tricyclazole, c) D. flagrans colony supplemented with 1 mM L-DOPA, (d) melanin particles extracted from D. flagrans and (e) commercial melanin. The 84% lower free-radical concentration can be seen in the tricyclazole-treated sample (b), and an increase of up to three-fold can be seen in the sample supplemented with L-DOPA(c), relative to no treatment (a). A sample MgO:Cr3+ (g of 1.9797) was used as a reference to obtain g for the sample studied.
