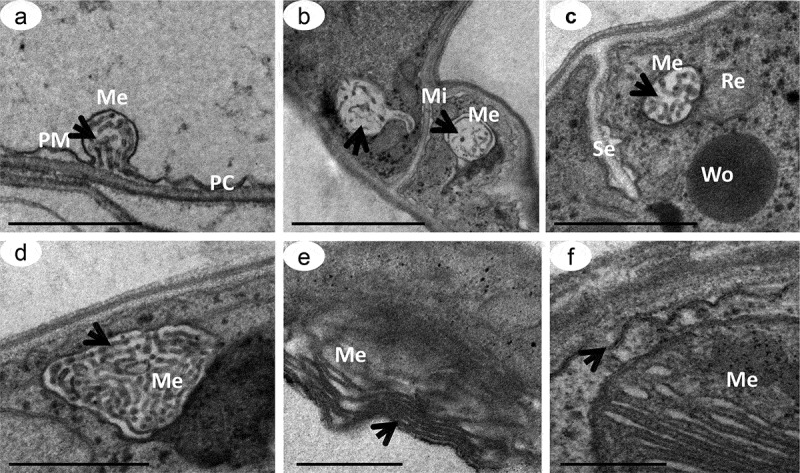
Figure 7.

Transmission electron microscopy of D. flagrans melanosomes. Ultrathin slices demonstrating the formation of melanosomes in stages II to III (a-d) in cells treated with 160μg/mL of tricyclazole and in stage III in cells treated with 1mM L-DOPA (e-f). Melanosome (Me), plasma membrane (PM), mitochondria (Mi), Woronin body (Wo) and septum between hyphae (Se). Arrows show the arrangements of internal matrices in the melanosomes. Scale bars: 500 nm (a, d, e, f) and 1 μm (b, c).
