
Figure 5.
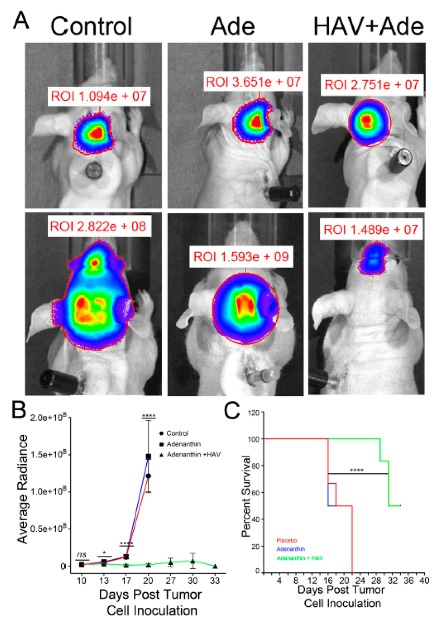
(A) Representative bioluminescence image of tumors in mice prior to the treatments (top panels) and following a 5-cycle treatment of control, Ade, or combination of HAV6 and Ade (bottom panel). (B) Quantitative analyses of the bioluminescence from tumors as outlined in the regions of interest (ROI) and normalized to background intensity for all tumor mice receiving control, Ade, or combination of HAV6 and Ade. (C) Kaplan-Maier survival curve of MBL tumor mice following the five-cycle treatment of control, Ade, or combination of HAV6 and Ade. Each treatment group consisted of six mice.