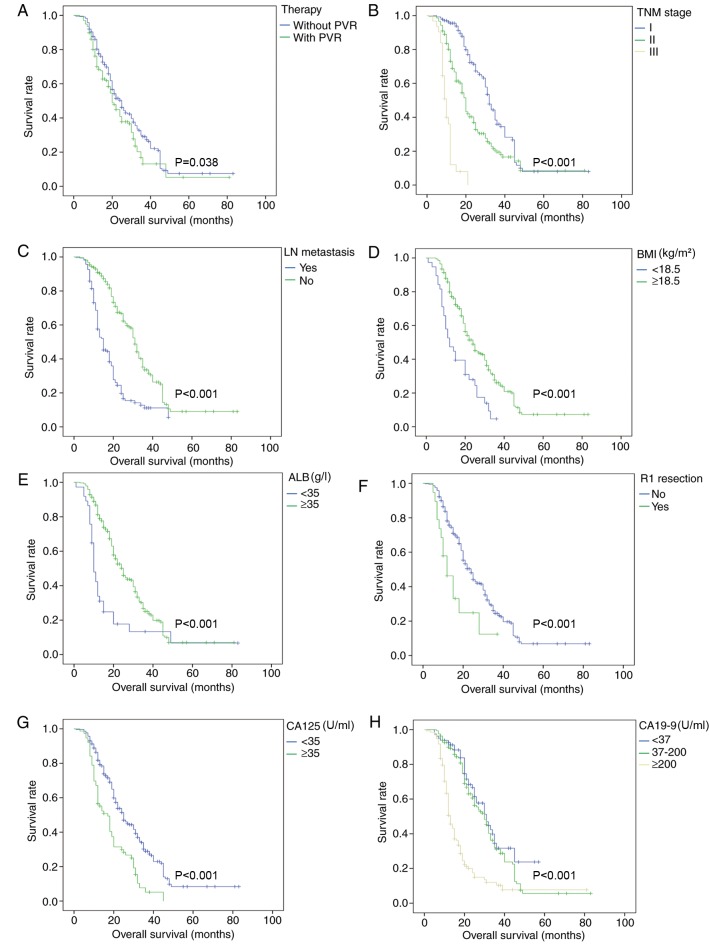
Figure 1.
Overall survival curves before propensity score matching. Survival analysis was conducted in all enrolled patients for various factors, including (A) therapy, (B) TNM stage, (C) lymph node metastasis, (D) BMI (kg/m2), (E) ALB (g/l), (F) R1 resection (microscopic positive margin), (G) CA125 (U/ml) and (H) CA19-9 (U/ml) before propensity score matching. PVR, portal vein resection; TNM, Tumor-Node-Metastasis; BMI, body mass index; ALB, albumin; CA125, carbohydrate antigen 125; CA19-9, carbohydrate antigen 19-9; LN, lymph node.

