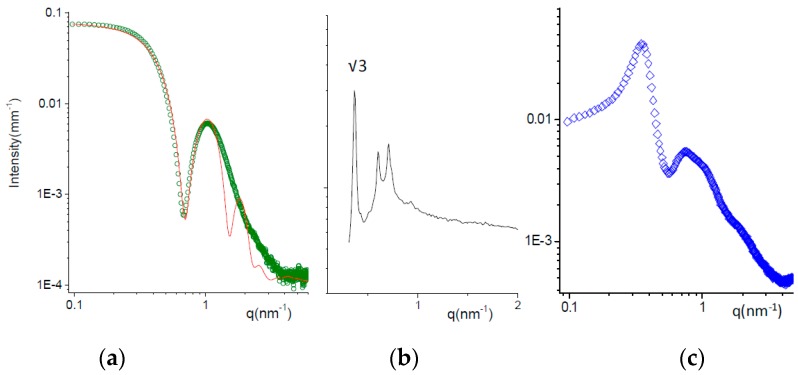
Figure 2.
SAXS spectra of micellar solutions at T = 25 °C. (a) Formulation T (green dots); fitting curve (red line) obtained with a core-shell-sphere model for the micellar form factor combined with a hard-sphere structure factor. (b) Formulation P (black line). The position of characteristic peaks are reported in the Supplementary Materials. The ratio between the first observed peak and the first order peak position q * is reported. The ordered phase is a face-centered cubic (FCC) micellar phase. (c) Formulation TP (50:50 mole ratio).

