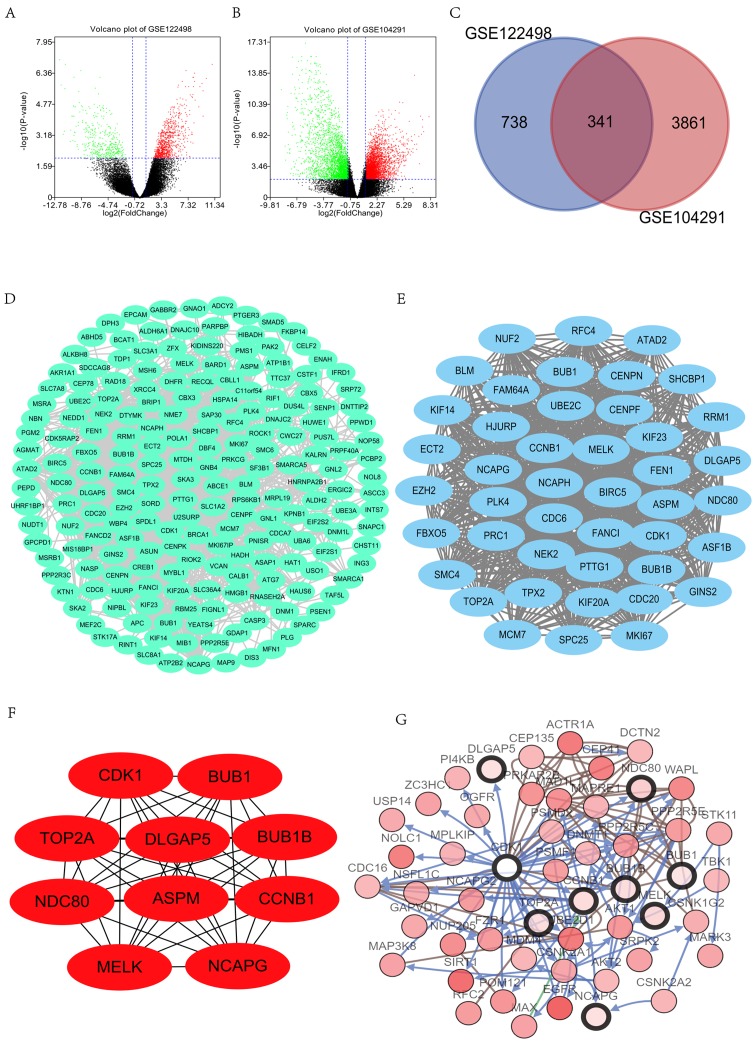
Figure 1.
Identification of DEGs and PPI network construction. (A) Volcano plot presents the difference between non-GBM and GBM tissues after analysis of the datasets GSE122498 with GEO2R. Downregulated genes are presented in green, and upregulated genes are presented in red. (B) Volcano plot presents the difference between non-GBM and GBM tissues after analysis of the datasets GSE104291 with GEO2R. The green presents the down-regulated genes, and the red presents the up-regulated genes. (C) Venn diagram indicated that 341 genes were contained in the GSE122498 and GSE104291 datasets simultaneously. (D) The PPI network of DEGs was constructed using Cytoscape. (E) Most significant module was obtained from PPI network of DEGs using MCODE, including 44 nodes and 884 edges. (F) Network of hub genes. (G) Hub genes and their co-expression genes were analyzed using cBioPortal. Nodes with a bold black outline represent hub genes. Nodes with a thin black outline represent the co-expression genes. *P<0.05. GBM, glioblastoma; DEGs, differentially expressed genes; PPI, protein-protein interaction; GEO, Gene Expression Omnibus; MCODE, Molecular Complex Detection.

