Figure 2.
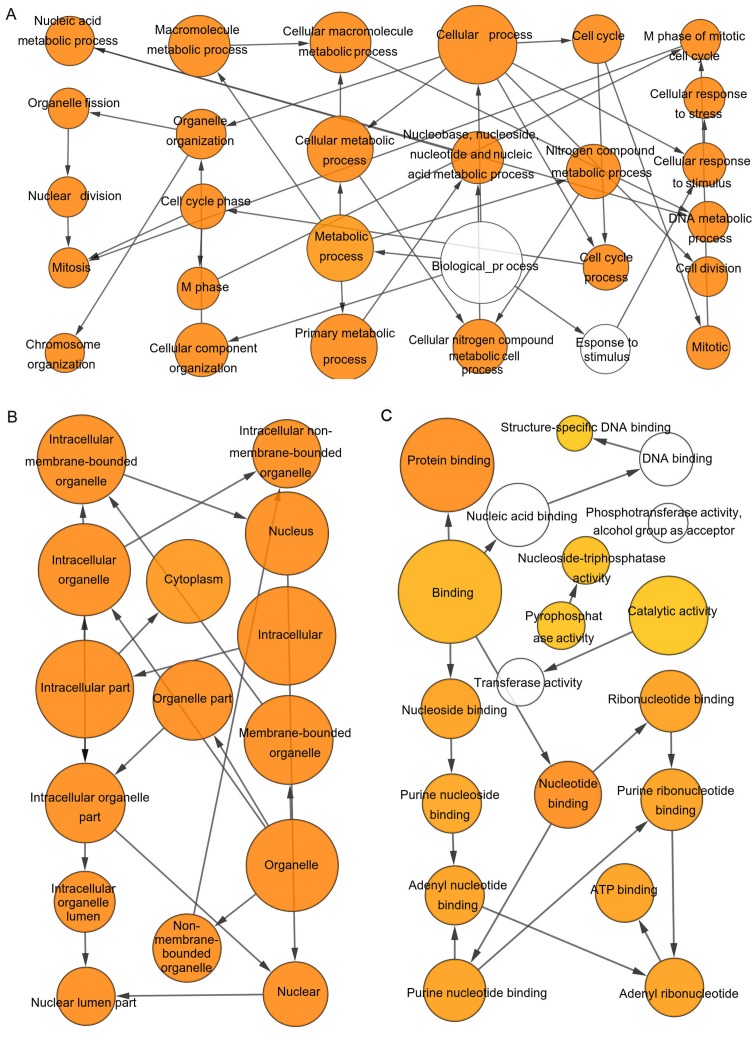
Enrichment analysis via The Biological Networks Gene Oncology tool. (A) Biological process, (B) cellular components, and (C) molecular function analysis of hub genes was constructed. The color depth of nodes refers to the corrected P-value of ontologies, and the deepest shade represented the most significant enrichment term. The size of nodes refers to the numbers of genes that are involved in the ontologies. P<0.01 was considered to indicate a statistically significant difference.

