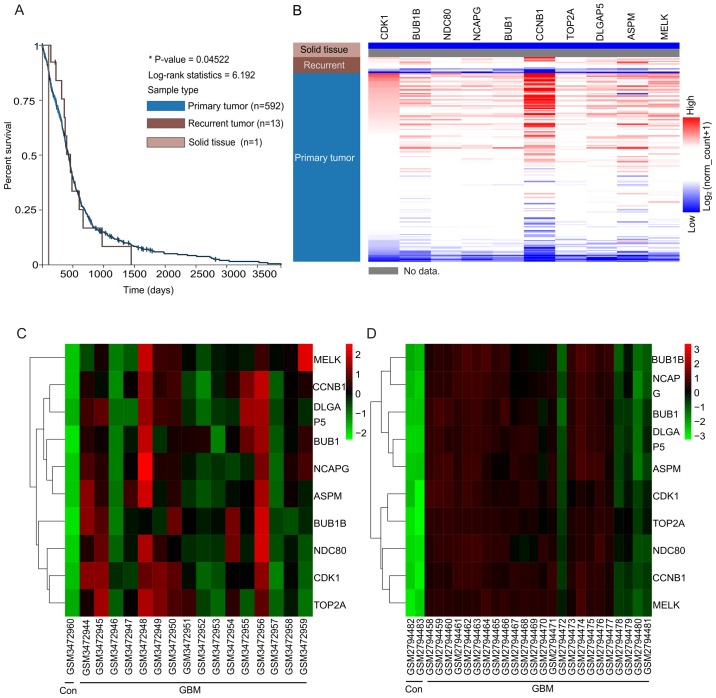
Figure 3.
University of California Santa Cruz analysis, and heatmaps of the expression levels of hub genes. (A) Overall survival rate analysis of patients with GBM. P<0.05 was considered statistically significant. (B) Hierarchical clustering of hub genes. The samples under the pink bar are normal samples, the samples under the brown bar are recurrent GBM samples and the samples under the blue bar are primary GBM samples. Red, upregulation of genes; blue, downregulation of genes. (C) Hierarchical clustering showed that the hub genes could differentiate the non-GBM samples from the GBM samples in the GSE122498. (D) Hierarchical clustering showed that the hub genes could differentiate the non-GBM samples from the GBM samples in the GSE104291 dataset. Red, upregulation of genes; green, downregulation of genes; GBM, glioblastoma.

