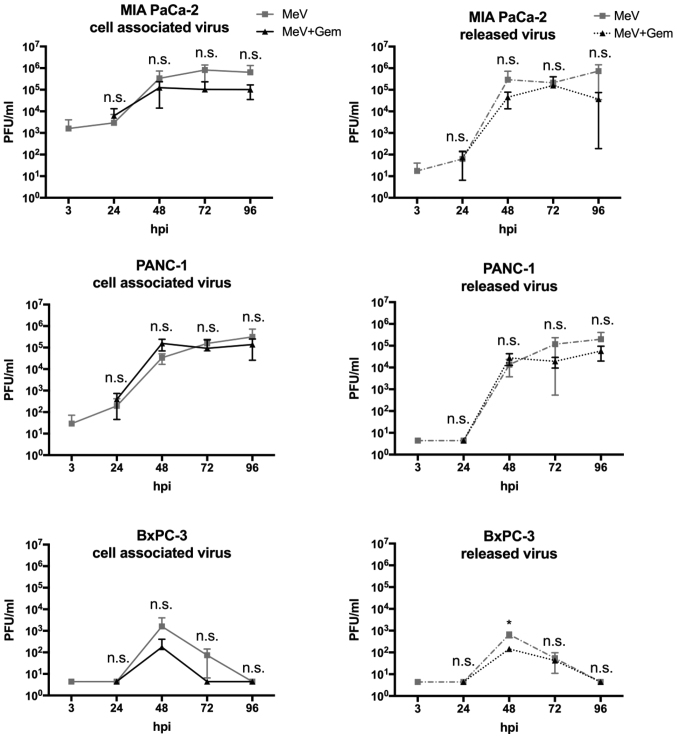
Figure 3.
Virus growth curves illustrating the course of viral replication in pancreatic cancer cells infected with oncolytic MeV. Virus growth of MeV-SCD (here denoted as MeV) was determined both in cell suspensions (continuous line graphs, cell associated virus) as well as in tumor cell culture supernatants (dotted line graphs, released virus). Viral replication was compared between: i) Single treated, i.e., ‘only’ infected tumor cells (MeV; mono-virotherapy, grey graphs); and ii) chemovirotherapeutic treated tumor cells, being infected first and then treated additionally with gemcitabine at 3 hpi (MeV+Gem, black graphs). Notably, tumor-cell specific multiplicities of infection of MeV and concentrations of Gem were used equal to the concentrations employed before in the viability assays (Sulforhodamin B and MTT). Except for the 48-h-value of released virus in the cell line BXPC-3, there was no statistically significant difference between the values of viral growth with or without Gem. All statistical analyses were conducted with Bonferroni's multiple comparison test. *P<0.05 vs. MeV-Gem. PFU, plaque forming units; n.s., not significant; hpi, hours post infection; GEM, gemcitabine; MeV, measles vaccine virus.

