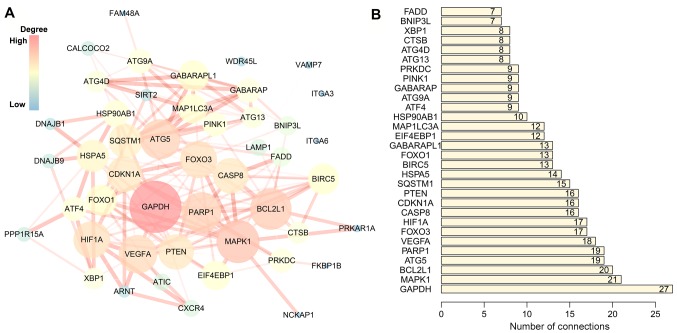
Figure 3.
PPI network of prognostic autophagy-specific genes in multiple myeloma. (A) PPI network of prognosis associated ARGs. The size and brightness of the circle represents the degree of connection. The larger and brighter circles are the hub genes in the network. The thickness of the lines represents the combined score. (B) Top 30 hub genes in the PPI network. ARG, autophagy-related gene; PPI, protein-protein interaction.

