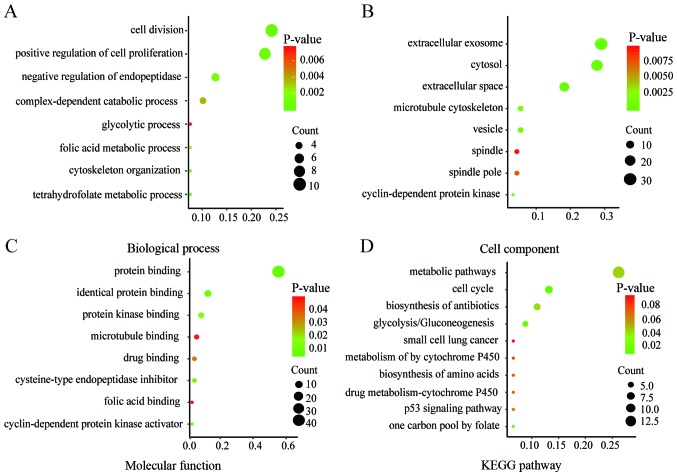
Figure 2.
KEGG and GO enrichment plots of DEGs. The plots from the GO enrichment analysis of DEGs for (A) biological processes (B) cell and (C) molecular function were obtained using DAVID and drawn using Image GP. (D) KEGG enrichment analysis was performed using DAVID, the bubble plot of KEGG analysis was drawn using Image GP. KEGG, Kyoto Encyclopedia of Genes and Genomes; GO, Gene Ontology; DAVID, Database for Annotation, Visualization and Integrated Discovery.

