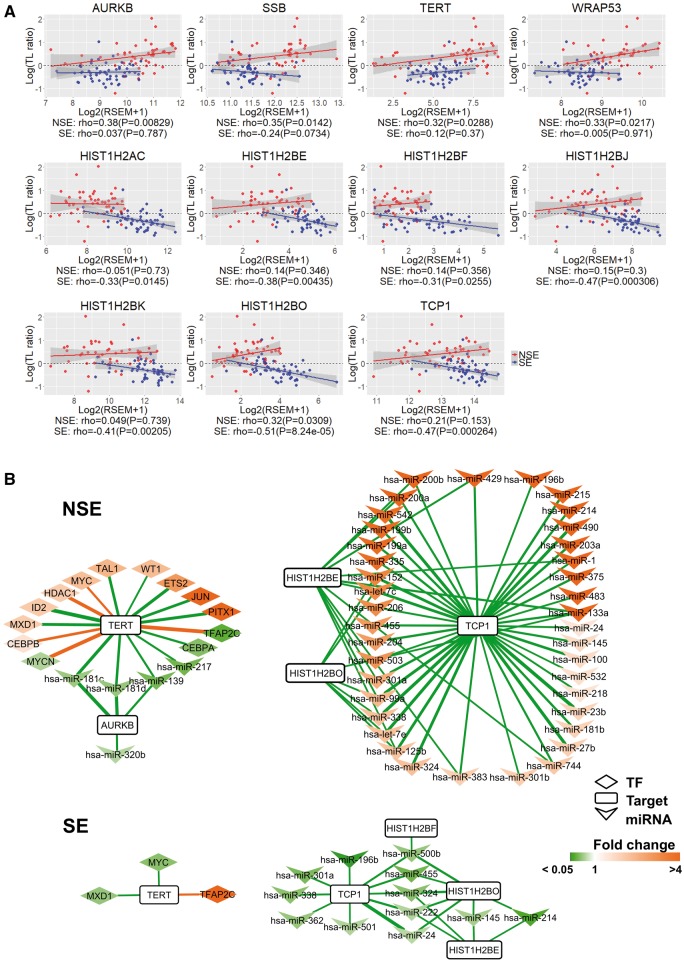
Figure 4.
Comparison of correlation and regulator networks between NSE and SE within 11 TelGenes. (A) Spearman's rank correlation coefficient between TL alteration and expression of 11 TelGenes in NSE and SE. Four highly expressed TelGenes in NSE versus SE, and seven highly expressed TelGenes in SE versus NSE. X-axis is for gene expression and Y-axis for log(TL ratio). TL ratio: tTL/nTL. For each gene, a linear regression model was fitted using log(TL ratio) versus its gene expression in NSE (red) and SE (blue). P: P-value. For each gene in each subtype, the fitted lines are displayed in NSE (red) and SE (blue), and the shaded area indicates 95% confidence interval. (B) Network of TFs and miRNAs for TelGenes between NSE and SE. Defined the TFs–target (Spearman's rank correlation coefficient |ρ| > 0.3) and miRNA–target (ρ < −0.3) pairs with P-value < 0.05, |log2FC| > 0.585 and FDR < 0.05. Edges in green: negative correlation; edges in orange: positive correlation; and edge thickness is proportional to the correlation value. Box in orange: higher expression genes or miRNAs in NSE or SE. Box in green: low expression genes or miRNAs in NSE or SE.

