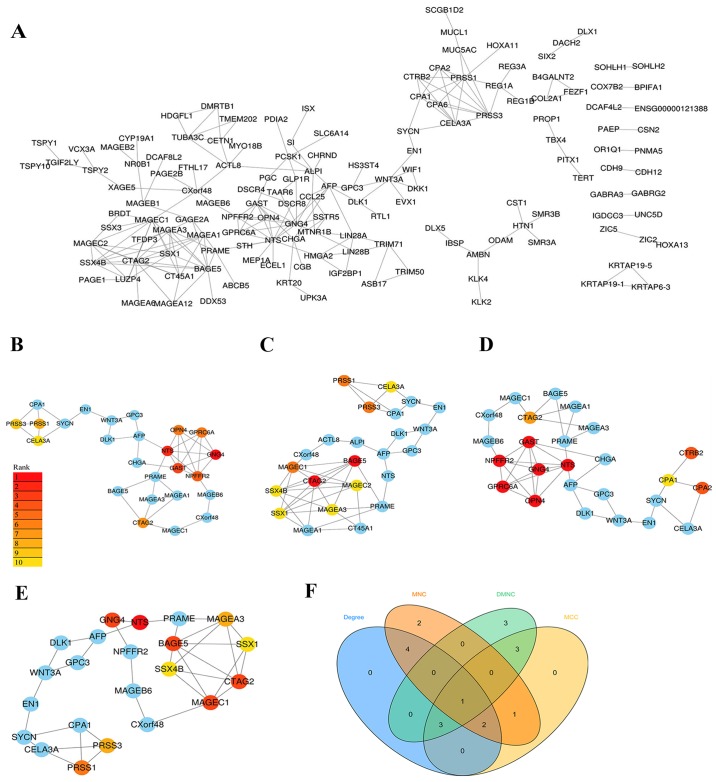
Figure 2.
PPI network of DEGs identified in samples from The Cancer Genome Atlas. (A) PPI network of the upregulated DEGs exhibiting statistically significant difference between. Four subnetworks were obtained by different analyses with the (B) MCC, (C) DMNC, (D) MNC and (E) degree methods. Colour labelling from red to yellow represented the top 10 nodes of each subnetwork, while other nodes in the subnetwork appear blue. (F) Venn diagram showing the intersection set of hub genes obtained from the four topological analysis methods. PPI, protein-protein interaction; DEG, differentially expressed gene; MCC, maximal clique centrality; DMNC, density of maximum neighbourhood component; MNC, maximum neighbourhood component.

