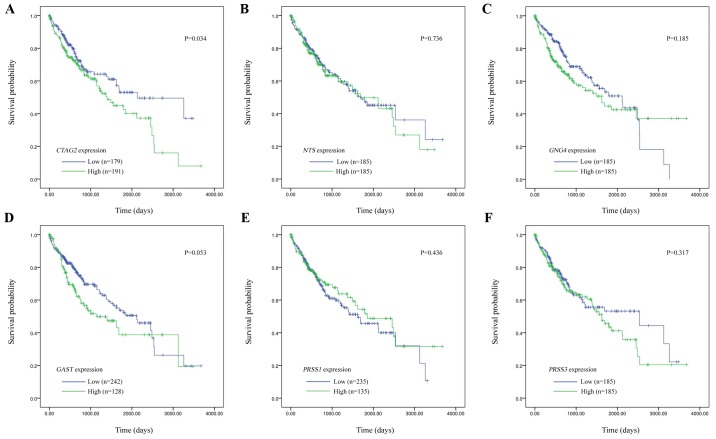
Figure 3.
Kaplan-Meier curves indicating the correlation of the overall survival of hepatocellular carcinoma patients with different hub genes, including: (A) CTAG2 (P=0.034); (B) NTS (P=0.736); (C) GNG4 (P=0.185); (D) GAST (P=0.053); (E) PRSS1 (P=0.436); and (F) PRSS3 (P=0.317). The patients were divided into two groups according to the expression of hub genes. The blue curve represents the low-expression group, while the green curve represents the high-expression group. CTAG2, cancer/testis antigen 2.

