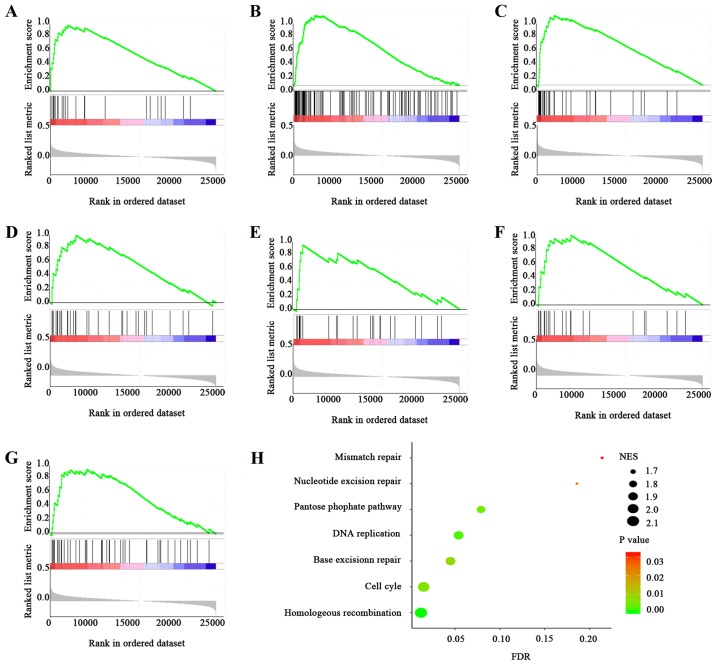
Figure 5.
GSEA of hepatocellular carcinoma data from The Cancer Genome Atlas database. Enrichment plots for significant pathways identified by GSEA include (A) homologous recombination, (B) cell cycle, (C) DNA replication, (D) base excision repair, (E) pentose phosphate pathway, (F) mismatch repair and (G) nucleotide excision repair. (H) Graph indicating the enrichment of each pathway, with the size of each point representing the NES value and the colour representing the P-value. GSEA, gene set enrichment analysis.

