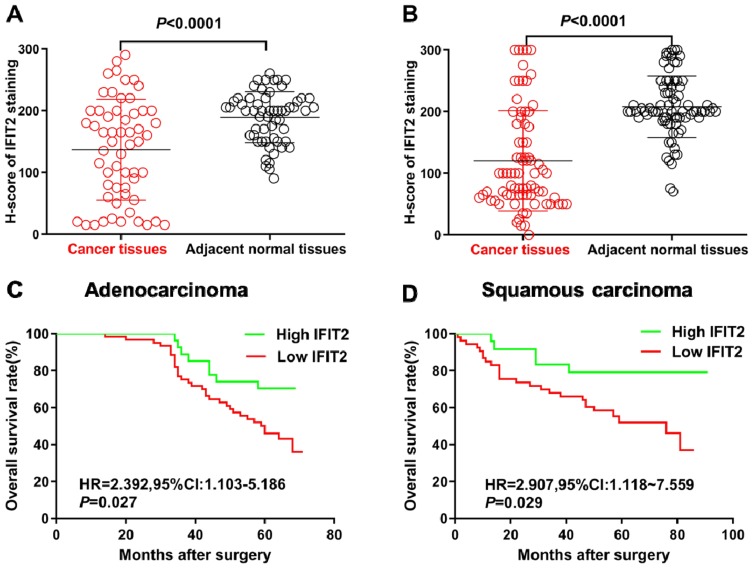
Figure 2.
Immunohistochemical staining of IFIT2 in lung cancer tissue and adjacent normal tissue. (A) Wilcoxon rank test showed that H-score in lung adenocarcinoma tissues was significantly lower than that in adjacent normal tissue (P< 0.0001). (B) Wilcoxon rank sum test showed that H-score in lung squamous cell carcinoma was significantly lower than that in normal tissue (P< 0.0001). (C) The correlation between IFIT2 expression and OS in lung adenocarcinoma: Kaplan–Merier survival analysis showed that the OS of patients with low IFIT2 expression was significantly poorer than that of patients with high IFIT2 expression (HR = 2.392, 95% CI: 1.103–5.186, P = 0.027). (D) The correlation between IFIT2 expression and OS in lung squamous cell carcinoma: Kaplan–Merier survival analysis showed that the OS of patients with low IFIT2 expression was significantly poorer than that of patients with high IFIT2 expression (HR = 2.907, 95% CI: 1.118–7.559, P = 0.029).
Abbreviation: IFIT2, interferon-induced proteins with tetratricopeptide repeats 2.

