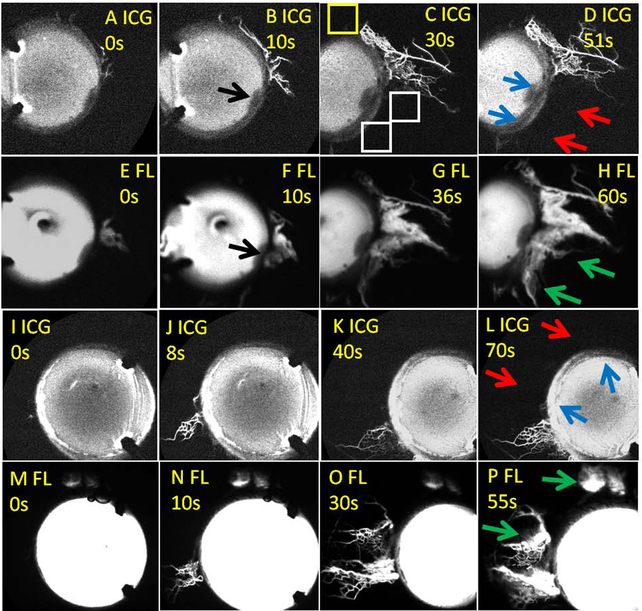
Figure 3. Sequential Aqueous Angiography in Glaucoma Patients with TMB in Initially Low Outflow Regions Showing New Angiographic Patterns.
(A-H) The first patient. (I-P) The second patient. (A-D and I-L) First, indocyanine green (ICG) aqueous angiography was performed. D/L) Second, TMB was conducted (blue arrows). (E-H and M-P) Third, fluorescein (FL) aqueous angiography was performed immediately after TMB. (B/F) In the first patient, black arrows point out conjunctival pigment on the cornea that blocked fluorescence transmission. This location serves as a reference point across all images for that eye. D/L) Red arrows point out nasal regions of the eyes without initial ICG angiographic signal. H/P) Green arrows point out regions of new fluorescein angiographic signal after TMB. (C) This image serves as an example of how to calculate an angiographic signal intensity ratio. A 75 × 75-pixel region of interest was placed post-limbal near the region of TMB (white boxes). Then for each region of interest, the signal intensity was normalized by dividing it by the signal in a region of known background away from proposed areas of TMB (yellow box). This allowed for assessment of signal intensity in any image, internally normalized to the settings on the Spectralis. A ratio of 1 would imply that the signal intensity in that region of interest was no different than the background. Because these values were ratios, they have no units. s = seconds after signal initiation.

