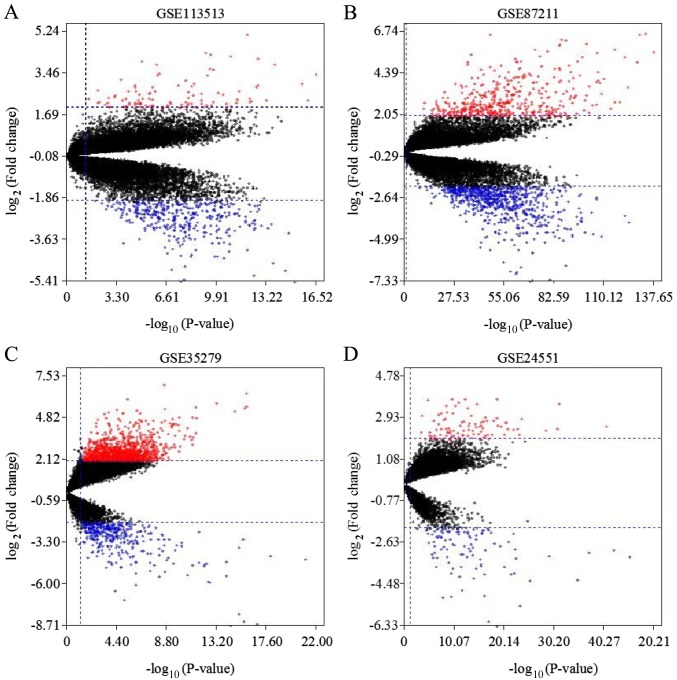
Figure 3.
Volcano plot of DEGs in datasets GSE113513, GSE87211, GSE35279 and GSE24551. Red dots represent upregulated DEGs and blue dots represent downregulated DEGs with a threshold of |log2FC|≥2.0 and adjusted P<0.05 in datasets (A) GSE113513, (B) GSE87211, (C) GSE35279 and (D) GSE24551. DEGs, differentially expressed genes; FC, fold change.

