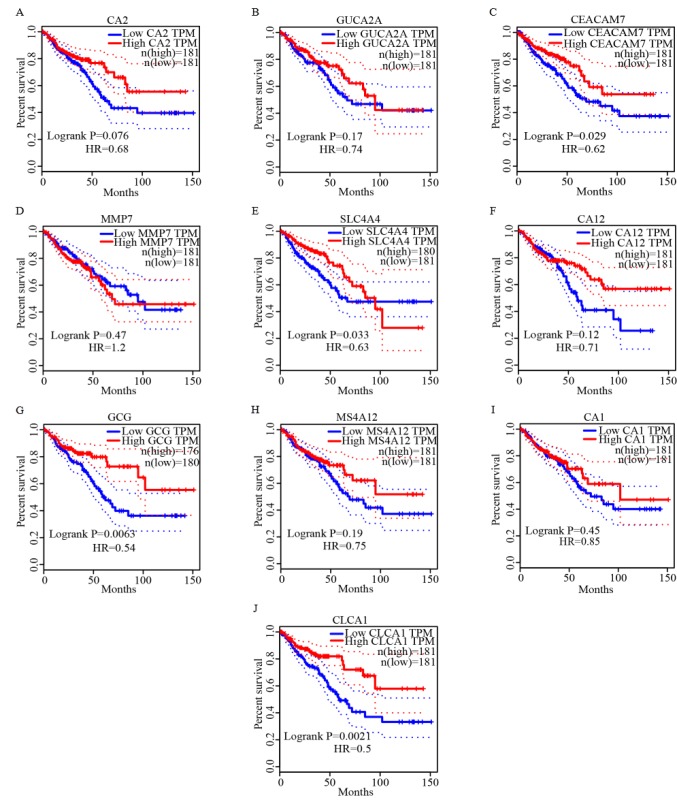
Figure 6.
Survival curves of overall survival analysis of ten key genes. Survival curves of overall survival time of (A) CA2, (B) GUCA2A, (C) CEACAM7, (D) MM7, (E) SLC4A4, (F) CA12, (G) GCG, (H) MS4A12, (I) CA1 and (J) CLCA1. CA2, carbonic anhydrase 2; GUCA2A, guanylate cyclase activator 2A; CEACAM7, carcinoembryonic antigen-related cell adhesion molecule 7; MMP7, matrix metalloproteinase-7; SLC4A4, solute carrier family 4 member 4; GCG, glucagon; MS4A12, membrane-spanning 4-domains subfamily A member 12; CA2, carbonic anhydrase 2; CLCA1, calcium-activated chloride channel regulator 1; TPM, transcripts per million.

