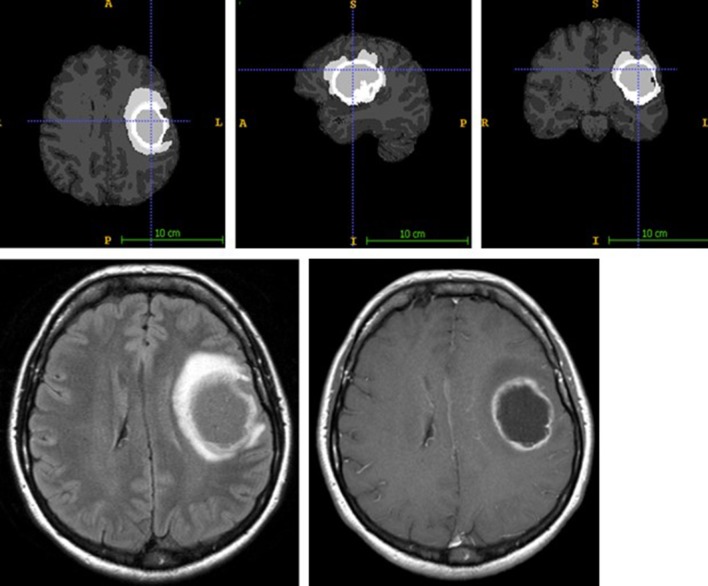
Figure 2.
ANTsR tumor segmentation result of glioblastoma, showing labels for contrast-enhancing tumor (very light gray), necrosis (dark gray), edema (light gray) (upper row; contrast non-enhancing tumor label is not depicted), and the corresponding FLAIR (lower row left) and T1 with contrast agency (lower row right) MR image.

