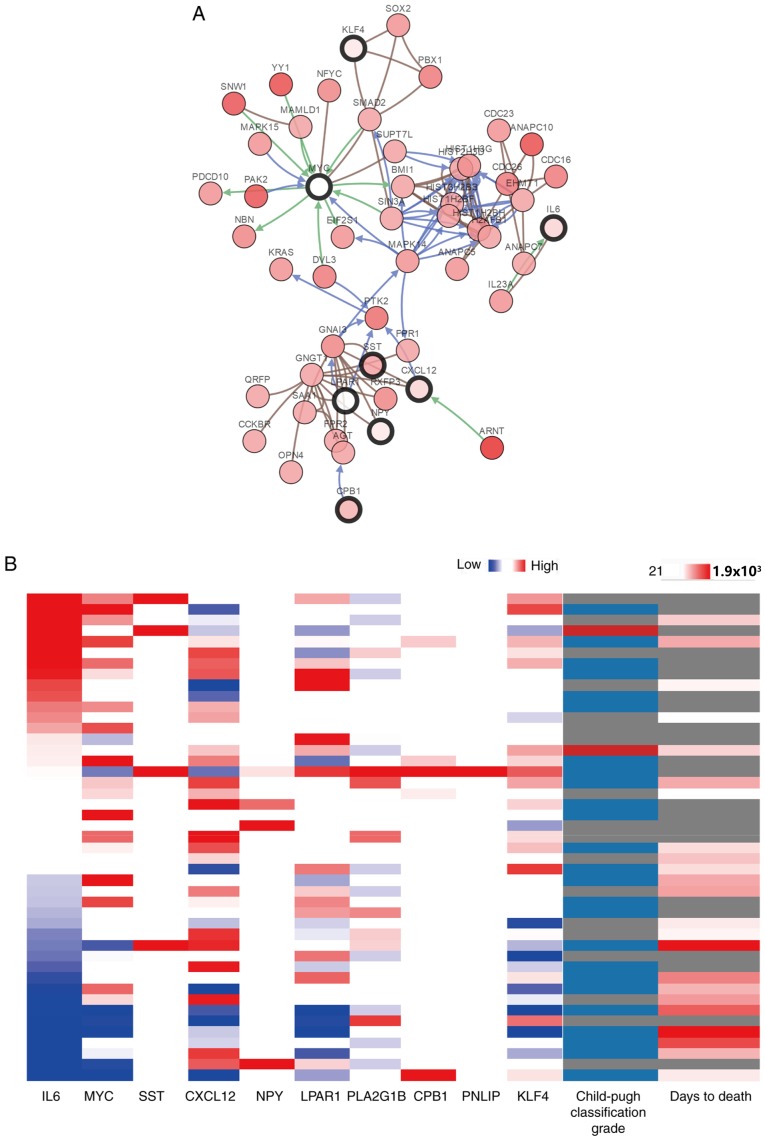
Figure 4.
(A) Hub genes and their co-expression genes were analyzed using cBioPortal. Nodes with a bold black outline represent hub genes. Nodes with a thin black outline represent the co-expression genes. (B) Hierarchical clustering of the hub genes was performed using the University of California, Santa Cruz Cancer Genomics Browser. The genomic heat map is presented on the left and the clinical heat map is presented on the right. Grey represents no data. Red and blue represent upregulation and downregulation, respectively. The blue and red cells in the Child-Pugh classification column represents grade A and B, respectively.

