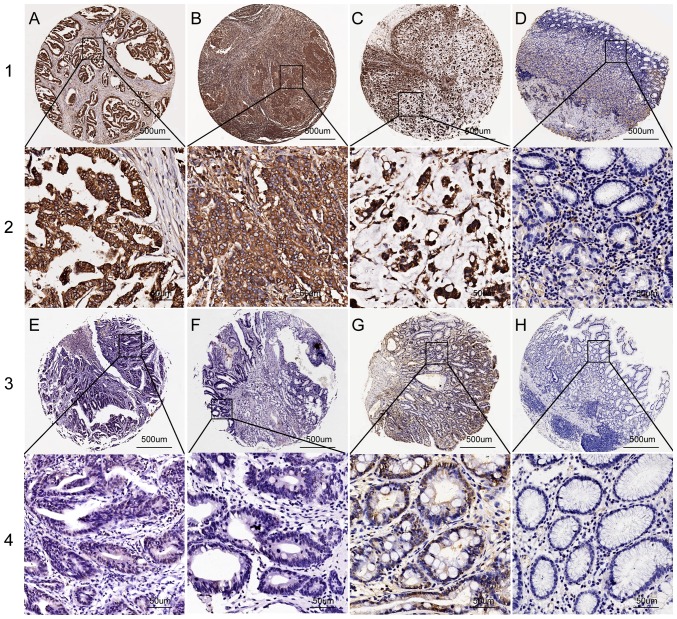
Figure 2.
Representative images of PSMA7 protein expression in gastric tissue TMA sections. Rows 1 and 3 use PSMA7 staining with ×40 magnification (scale bar, 500 µm), and rows 2 and 4 use PSMA7 staining with ×400 magnification (scale bar, 50 µm). (A) Moderately differentiated GC with high PSMA7 expression. (B) Poorly differentiated GC with high PSMA7 expression. (C) Signet ring cell GC with high PSMA7 expression. (D) Peritumoral tissues with low PSMA7 expression. (E) High-grade intraepithelial neoplasia with low PSMA7 expression. (F) Low-grade intraepithelial neoplasia with low PSMA7 expression. (G) Intestinal metaplasia with low PSMA7 expression. (H) Chronic gastritis with no PSMA7 expression. GC, gastric cancer; PSMA7, proteasome subunit α7.

