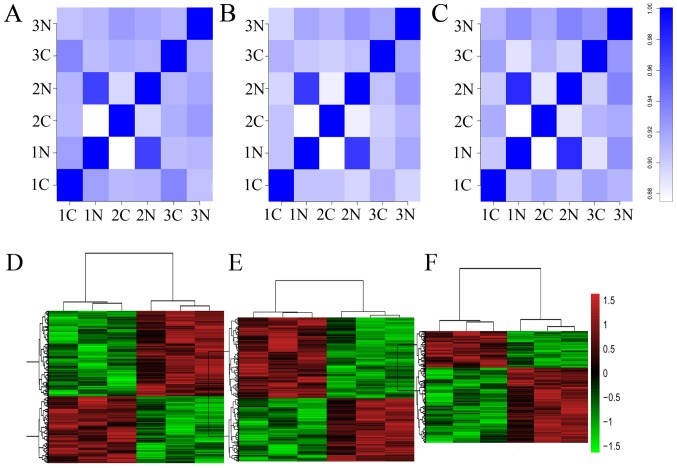
Figure 1.
Correlation plot and heat map of lncRNAs, circRNAs and mRNAs in ESCC and para-carcinoma tissues. (A) The correlation among the six samples based on expression values of significantly altered lncRNAs. (B) The correlation among the six samples based on expression values of significantly altered circRNAs. (C) The correlation among the six samples based on expression values of significantly altered mRNAs. Heat map based on the expression values of significantly altered (D) lncRNAs, (E) cirRNAs and (F) mRNAs with fold changes ≥2.0 and P<0.05. lncRNAs, long noncoding RNAs; circRNAs, circularRNAs; ESCC, esophageal squamous carcinoma; C, ESCC tissues; N, control tissues.

