
Figure 4.
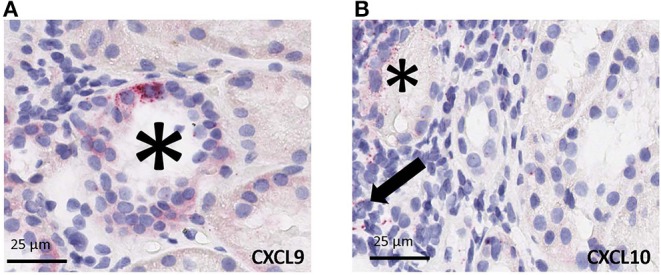
Cell specific gene expression of CXCL9 and CXCL10 by chromogenic in situ hybridization (ciSH) data agrees with gene expression data on bulk tissue. Representative images from biopsy samples with T-cell mediated rejection. Chromogenic in situ hybridization for CXCL9 (A) and CXCL10 (B) shows high-level expression on tubular epithelial cells (asterisks) and some scattered mononuclear cells (arrow), 400×. Rare signal was noted in some glomeruli, however no definite signal was detected in the vascular compartment or in the interstitium other than the inflammatory cells (32, 33).