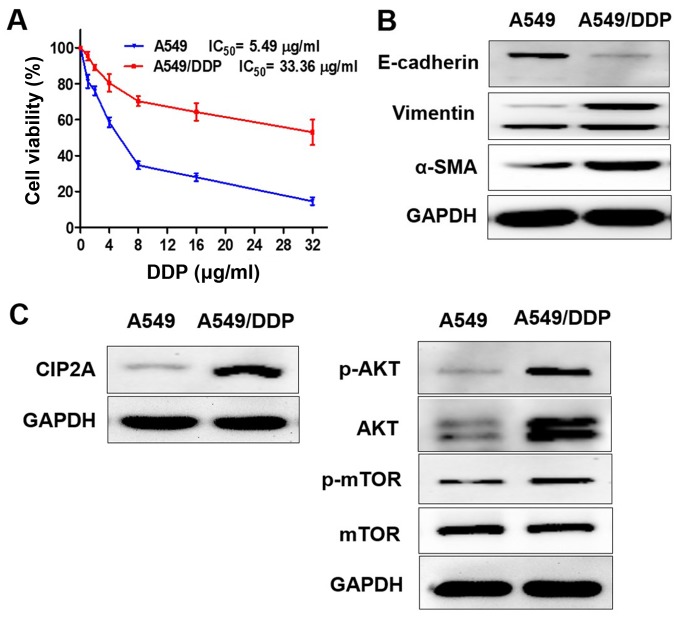
Figure 1.
Characterization of A549 and A549/DDP cells. (A) A549 and A549/DDP cells were exposed to different concentrations of DDP (1–32 µg/ml) for 24 h, and cell viability was determined by Cell Counting Kit-8 assay. The protein expression levels of (B) E-cadherin, vimentin, α-SMA and (C) CIP2A, p-AKT, AKT, p-mTOR were measured using western blotting; E, epithelial; SMA, smooth muscle actin; p-mTOR, phosphorylated mammalian target of rapamycin; AKT, protein kinase B; DDP, cisplatin; CIP2A, cancerous inhibitor of protein phosphatase 2A; IC50, half maximal inhibitory concentration.

