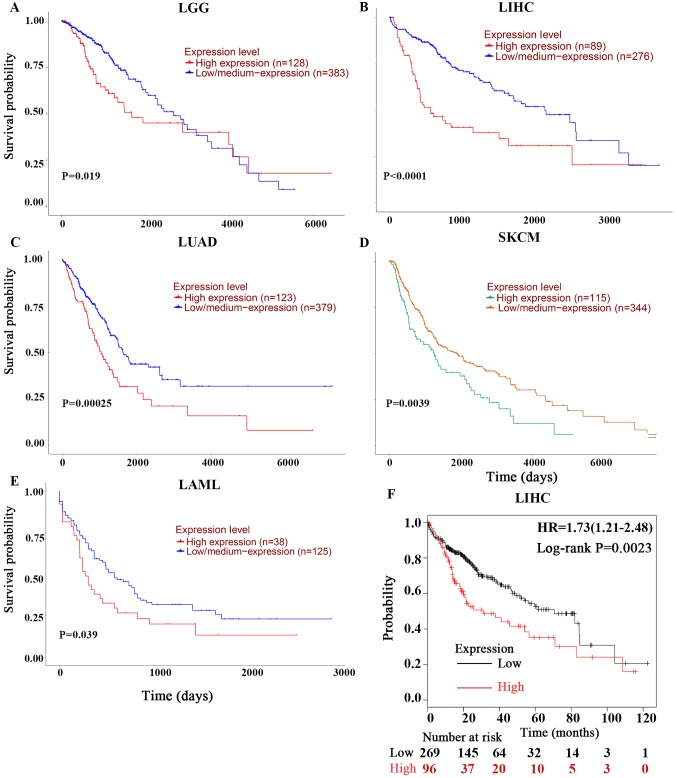
Figure 2.
Kaplan-Meier OS curves of cancer patients comparing PPIA high and low expression levels by UALCAN and Kaplan-Meier Plotter. The OS curves of (A) LGG, (B) LIHC, (C) LUAD, (D) SKCM and (E) LMAL derived from UALCAN. (F) was derived from Kaplan-Meier Plotter. OS, overall survival; PPIA, peptidyl-prolyl cis-trans isomerase A; LGG, brain lower grade glioma; LUAD, lung adenocarcinoma; SKCM, skin cutaneous melanoma; LIHC, liver hepatocellular carcinoma; LMAL, acute myeloid leukaemia.

