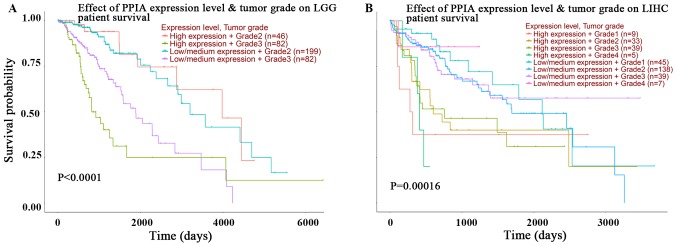
Figure 3.
Kaplan-Meier OS curves of different grade cancer patients comparing PPIA high and low expression levels by UALCAN. The OS curves of different grades and PPIA expression levels of (A) LIHC and (B) LGG respectively. OS, overall survival; LGG, brain lower grade glioma; LIHC, liver hepatocellular carcinoma; PPIA, peptidyl-prolyl cis-trans isomerase A.

