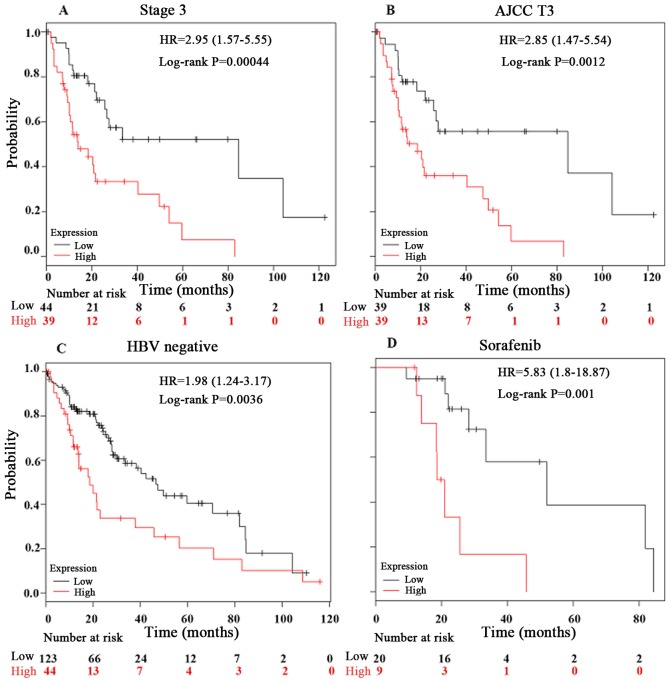
Figure 4.
Kaplan-Meier OS curves of LIHC patients in different conditions comparing peptidyl-prolyl cis-trans isomerase A high and low expression levels by Kaplan-Meier Plotter. The liver hepatocellular carcinoma OS curves of (A) stage 3, (B) AJCC T3, (C) HBV negative and (D) sorafenib-administered subgroups respectively. OS, overall survival; HBV, hepatitis B virus; HR, hazard ratio.

