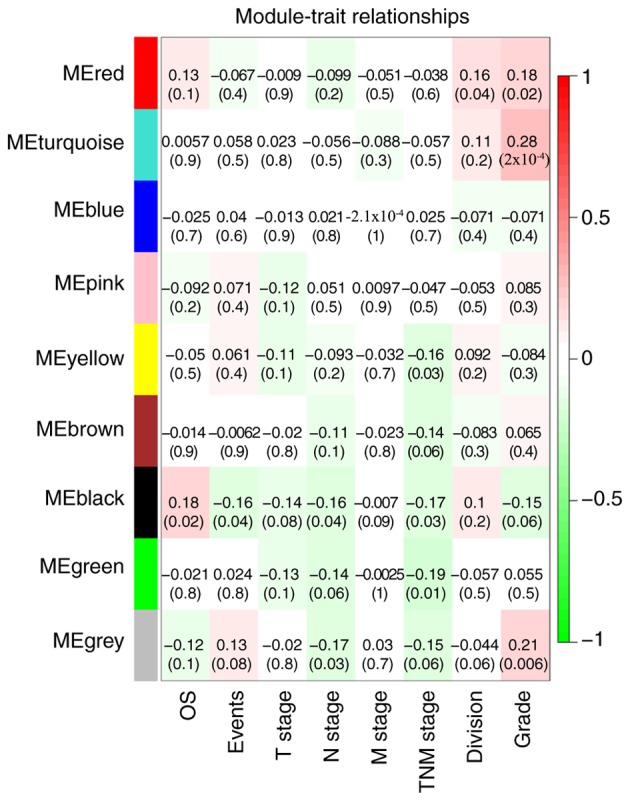
Figure 4.

Module-feature association. Each row corresponds to a module eigengene, and the column corresponds to a feature. Each cell contains the corresponding correlation coefficient and P-value. The table was color coded based on correlation according to the color legend. Red represents a positive correlation, green represents a negative correlation, and the darker the color, the greater the significance of the P-value. OS, overall survival; TNM, tumor-node-metastasis.
