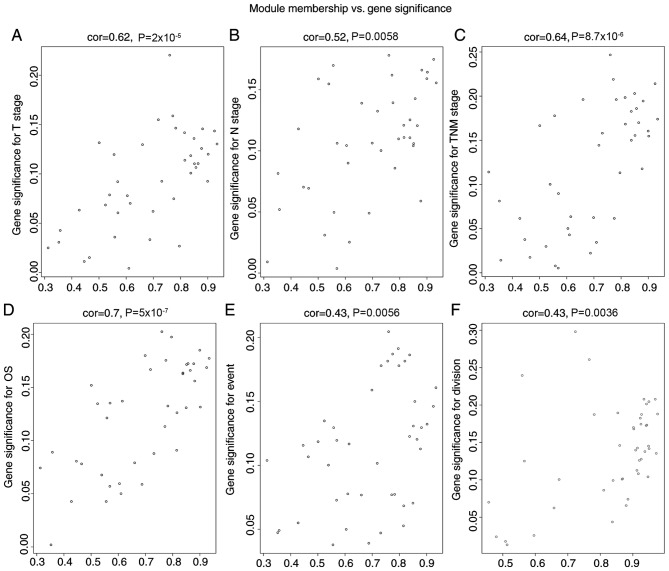
Figure 5.
Scatterplot of gene significance for (A) T stage, (B) N stage, (C) TNM stage, (D) OS and (E) death events vs. module membership in the black module. (B) Scatterplot of N stage in the black module. (F) Scatterplot of gene significance for anatomic division in the red module. There is a highly significant association between gene significance and module membership in these modules. TNM, tumor-node-metastasis; OS, overall survival; cor, correlation coefficient.

