Figure 6.

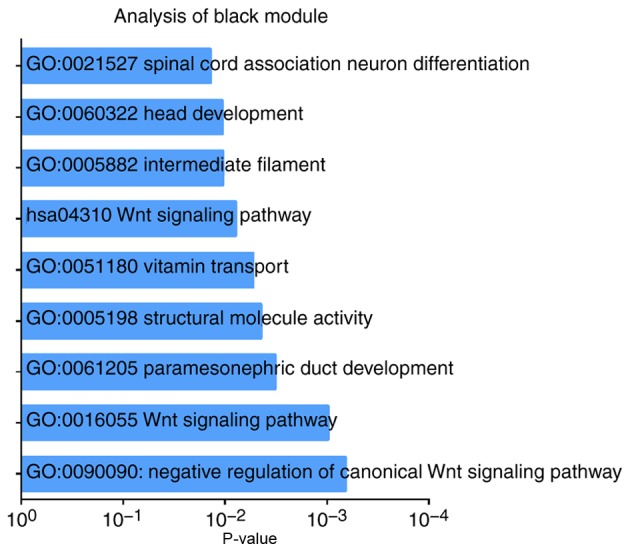
GO functional analysis and KEGG pathway enrichment for genes in the black module. The x-axis shows the-log10 (P-value) and the y-axis shows the GO and KEGG pathway terms. GO, Gene Ontology; KEGG, Kyoto Encyclopedia of Genes and Genomes.

GO functional analysis and KEGG pathway enrichment for genes in the black module. The x-axis shows the-log10 (P-value) and the y-axis shows the GO and KEGG pathway terms. GO, Gene Ontology; KEGG, Kyoto Encyclopedia of Genes and Genomes.