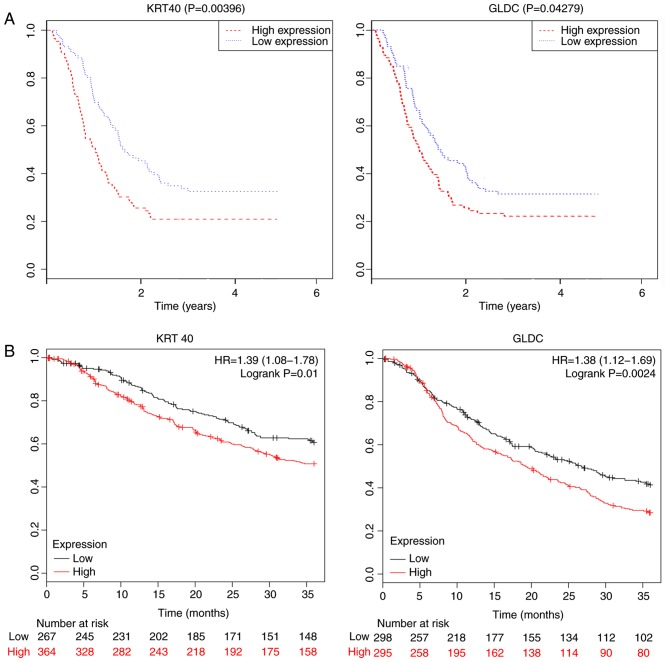
Figure 8.
(A) Kaplan-Meier curve obtained from the weighted prognostic index classification by KRT40 and GLDC gene expression in patents with gastric cancer from the TCGA database. (B) Kaplan-Meier curve of KRT40 and GLDC expression in patients with gastric cancer in the Gene Expression Omnibus database. The numbers in the brackets represent the confidence intervals. KRT40, keratin 40; GLDC, glycine decarboxylase; HR, hazard ratio.

