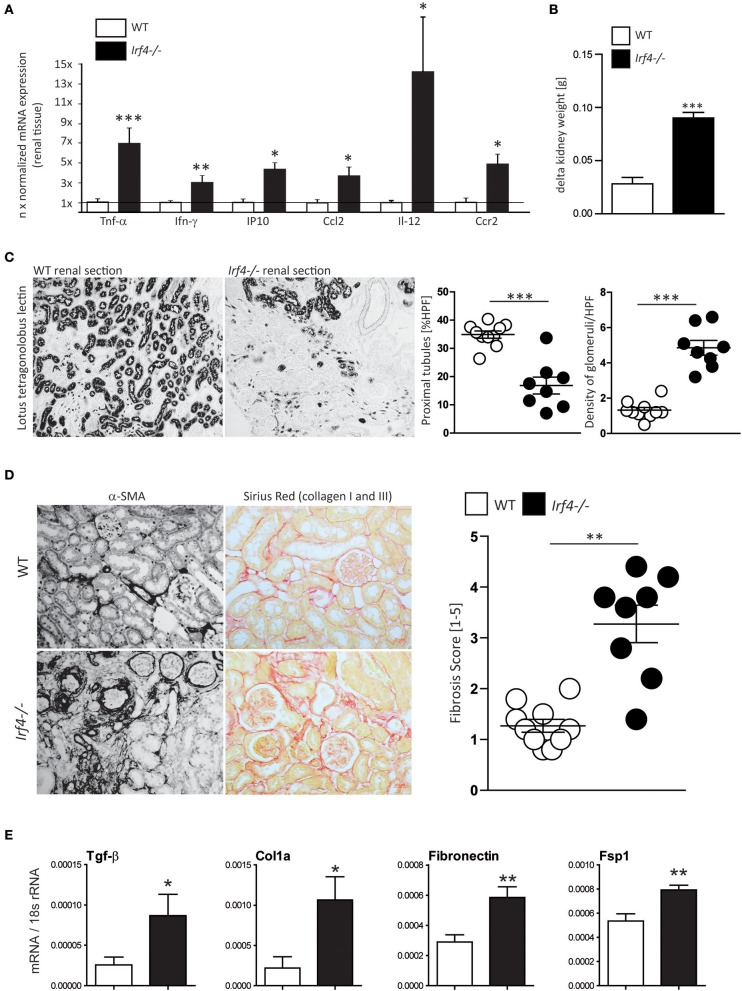
Figure 2.
(A) Relative mRNA expression of indicated genes from renal tissues 5 weeks after IRI was normalized per 18S rRNA and normalized to expression levels of WT mice. (B) Delta kidney weight was calculated as weight of the contralateral non-operated kidney—weight of the kidney that had undergone IRI 5 weeks after WT mice (n = 10) and Irf4−/−− mice (n = 8) had undergone unilateral IRI. (C) After 5 weeks, glomerular density was assessed by counting the number of glomeruli per HPF (n = 8–10 animals per group; each dot represents the average of at least three high-power fields per animal). Remaining tubular mass was estimated using quantification of tubular cross-sections per HPF [stained with lotus tetragonolobus lectin (LTL)] with image software. N = 8–10 animals per group (each dot represents the average of at least three high-power fields per animal) were quantified. (D) Renal fibrosis was assessed using smooth muscle actin and Sirius red stain stains; percentage of positive-stained area was used for calculation (n = 8–10 animals per group were quantitated). (E) Relative mRNA expression of indicated genes from renal tissues 5 weeks after IRI was normalized per 18S rRNA. mRNA expression of indicated profibrotic genes was determined from kidney lysates of WT (white bars) and interferon regulatory factor 4 (IRF4)–deficient mice (black bars). Data are shown as mean ± SEM. *p < 0.05, **p < 0.01, ***p < 0.001.

