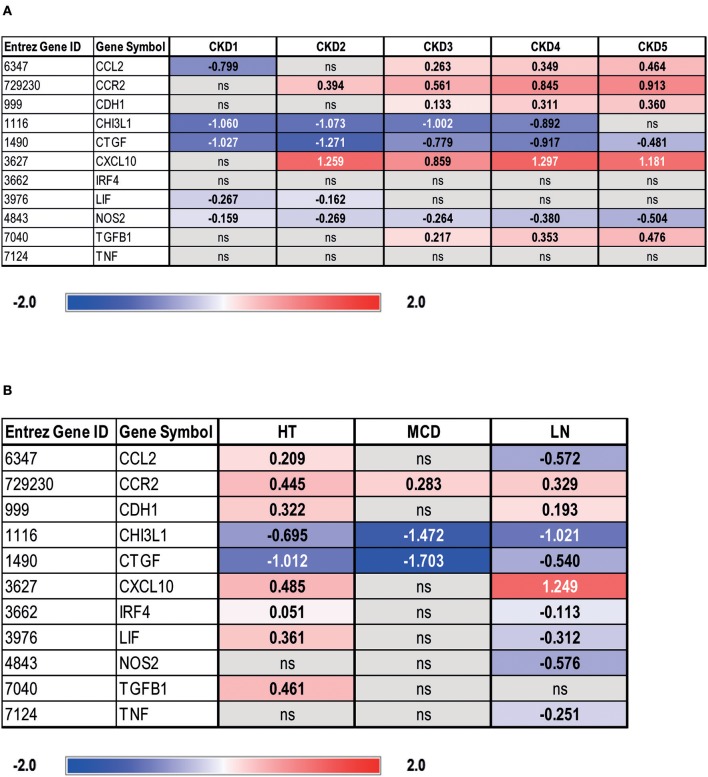
Figure 6.
Gene expression analysis of IRF4 and selected macrophage polarity genes in tubulointerstitium of manually microdissected biopsies from patients with different CKD stages (A) and renal diseases (B). Values are expressed as log2-fold change compared to controls (living donors, LDs). All represented genes are significantly changed (q < 0.05) and non-significantly changed genes denoted as ns. Chronic kidney disease 1 (CKD1): n = 56; CKD2: n = 46; CKD3: n = 37; CKD4: n = 26; CKD5: n = 10; living donor (LD): n = 42; hypertensive nephropathy (HT): n = 21; lupus nephritis (LN): n = 32; minimal change disease (MCD): n = 15.

