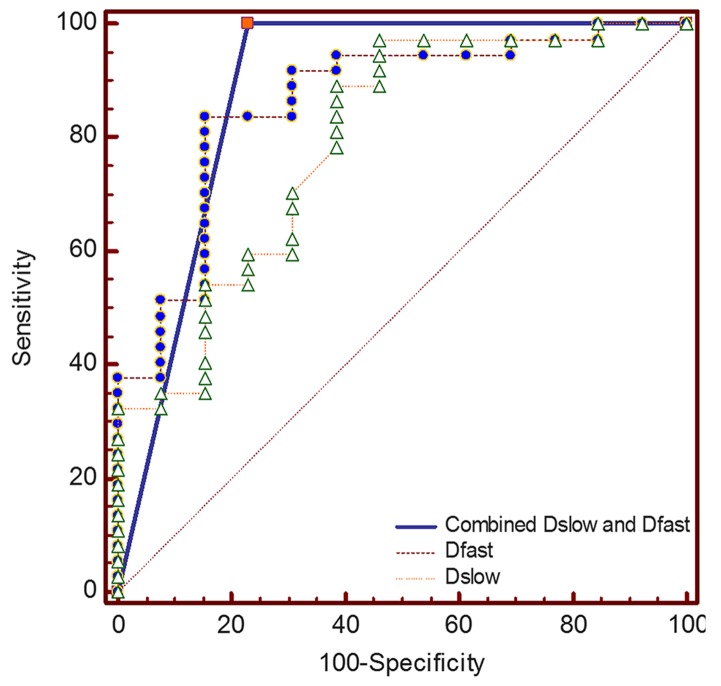
Figure 6.
ROC curves of Dslow and Dfast for differentiating pNENs from PDAC. The diagonal line is the reference, which indicates the results for a test with 50% sensitivity and 50% specificity. The highest AUC was obtained for combined Dslow and Dfast, which was closely followed by Dfast and Dslow alone. ROC, receiver operating characteristics; Dslow, slow apparent diffusion coefficient; Dfast, fast apparent diffusion coefficient; AUC, area under the curve; pNENs, pancreatic neuroendocrine neoplasms; PDAC, pancreatic ductal adenocarcinoma.

