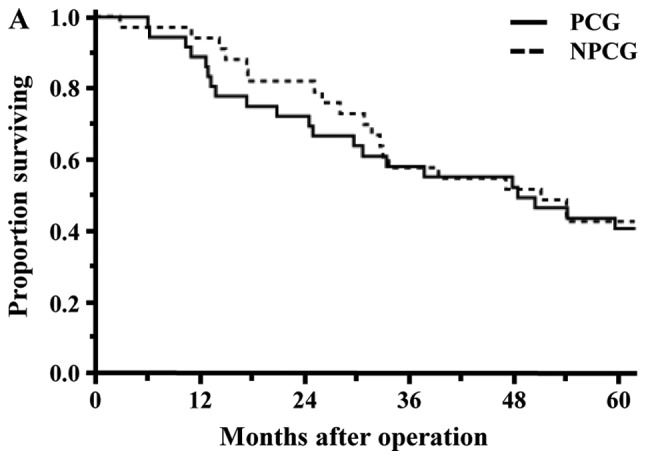
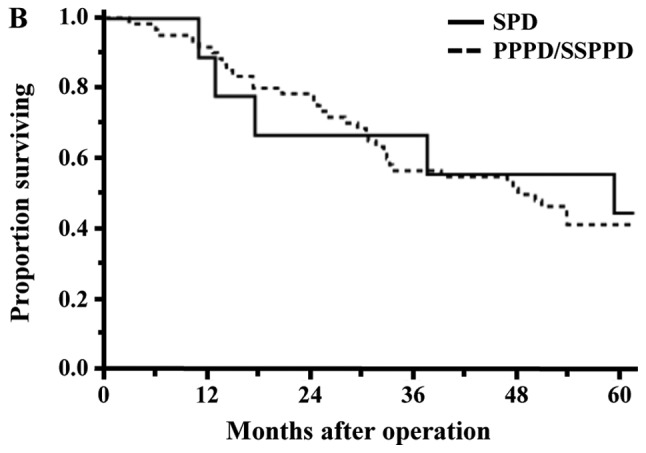
Figure 3.


Survival curves for the 69 patients who underwent pancreaticoduodenectomy for malignant tumors. (A) Survival rates between the PCG and NPCG groups were not significantly different (5-year overall survival, 40.7% vs. 42.4%; P=0.8773). (B) Survival rates between SPD and PPPD/SSPPD were also not significantly different (5-year overall survival, 44.4% vs. 41.0%; P=0.8199). PCG, pancreatic carcinoma group; NPCG, non-pancreatic carcinoma group; SPD, standard pancreatoduodenectomy; PPPD, pylorus-preserving pancreatoduodenectomy; SSPPD, subtotal stomach-preserving pancreatoduodenectomy.
