
Figure 4.
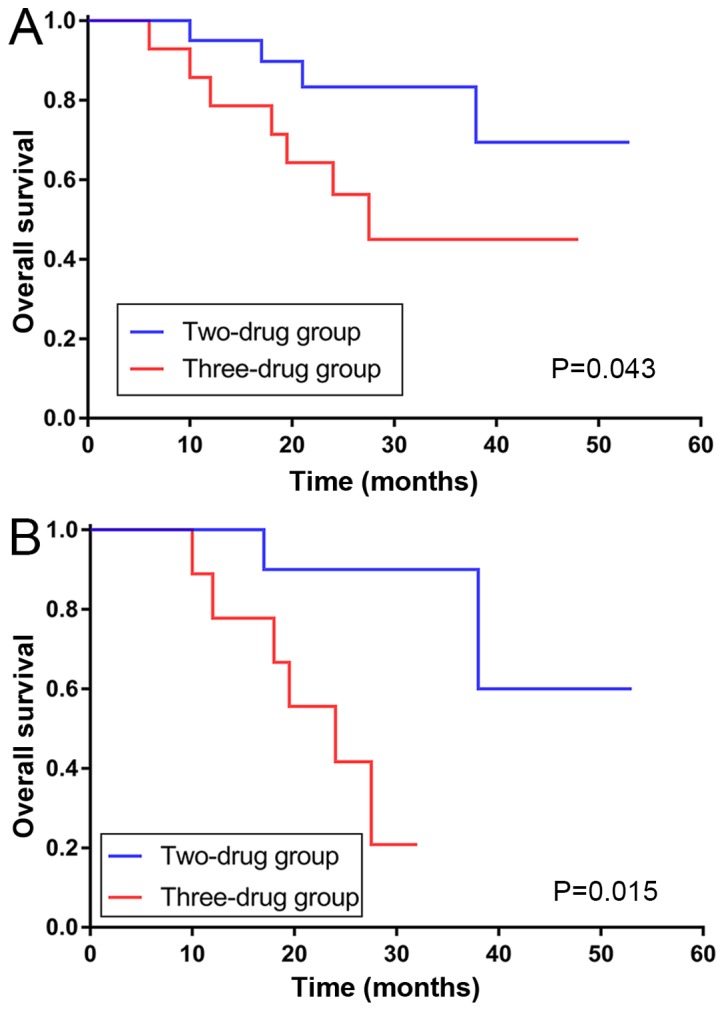
OS curves of subgroups. OS curve for the (A) ALDH1A1− subgroup, and (B) CD133+ and ALDH1A1− subgroups. OS, overall survival; ALDH1A1, aldehyde dehydrogenase-1A1; CD133, cluster of differentiation 133.
Official websites use .gov
A
.gov website belongs to an official
government organization in the United States.
Secure .gov websites use HTTPS
A lock (
) or https:// means you've safely
connected to the .gov website. Share sensitive
information only on official, secure websites.
OS curves of subgroups. OS curve for the (A) ALDH1A1− subgroup, and (B) CD133+ and ALDH1A1− subgroups. OS, overall survival; ALDH1A1, aldehyde dehydrogenase-1A1; CD133, cluster of differentiation 133.