
Figure 2.
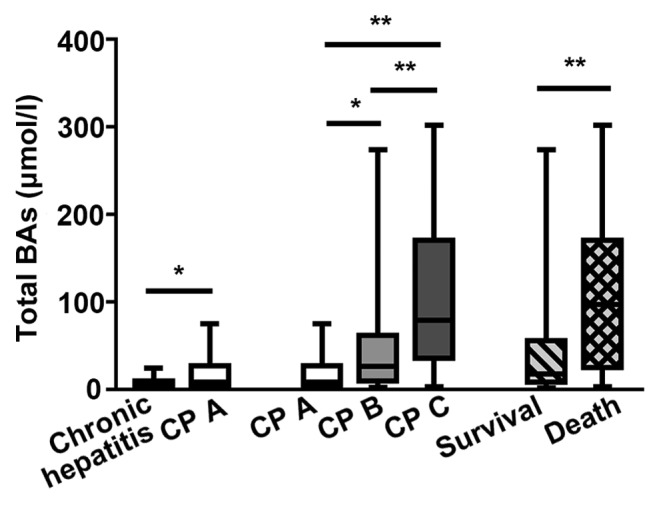
Box diagram of serum total BAs in the different CP groups of patients. *P<0.05, **P<0.01 [Kruskal-Wallis (followed by Dunn-Bonferroni post hoc method) or Mann-Whitney U test]. BA, bile acid; CP, Child-Pugh score; CP A, early stage cirrhosis; CP B, middle stage cirrhosis; CP C, late stage cirrhosis.