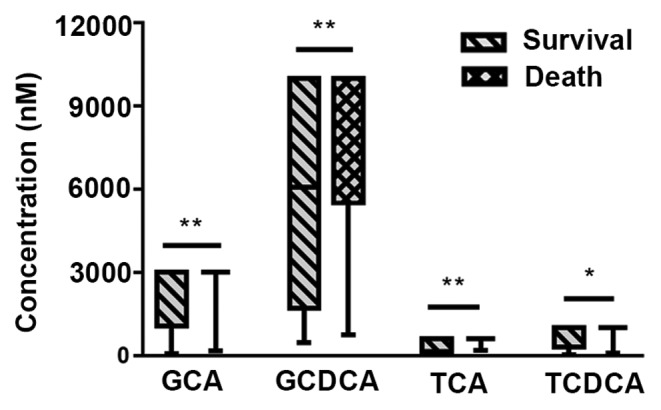
Figure 5.

Box diagrams of 4 individual BAs in the survival and death groups during the 6-month follow-up. *P<0.05, **P<0.01 (Mann-Whitney U test). The unusual shape of the box plots was due to levels of BAs exceeding the maximum detection range. GCA, glycocholic acid; GCDCA, glycochenodeoxycholic acid; TCA, taurocholic acid; TCDCA, taurochenoxycholic acid.
