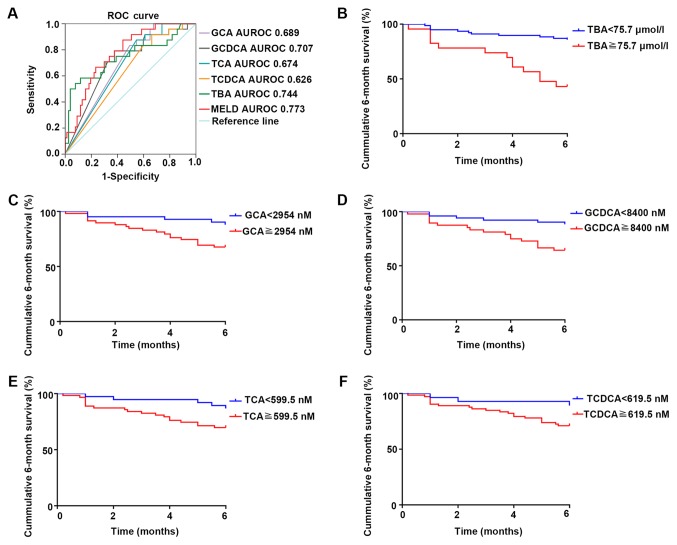
Figure 6.
Survival analysis of TBAs and the four individual BAs. (A) The ROC curve of TBAs and four individual BAs in predicting the 6-month survival (TBA: P<0.001; GCA: P=0.005; GCDCA: P=0.002; TCA: P=0.010; TCDCA: P=0.064). Kaplan-Meier plot of 6-month survival in patients with different levels of (B) ΤBAs, (C) GCA, (D) GCDCA, (E) TCA and (F) TCDCA (TBA: P<0.001; GCA: P=0.004; GCDCA: P=0.005; TCA: P=0.001; TCDCA: P=0.021). AUROC, area under the receiver operating characteristic curve; GCA, glycocholic acid; GCDCA, glycochenodeoxycholic acid; MELD, model for end-stage liver disease; ROC, receiver operating characteristic; TBA, total bile acids; TCA, taurocholic acid; TCDCA, taurochenoxycholic acid.

