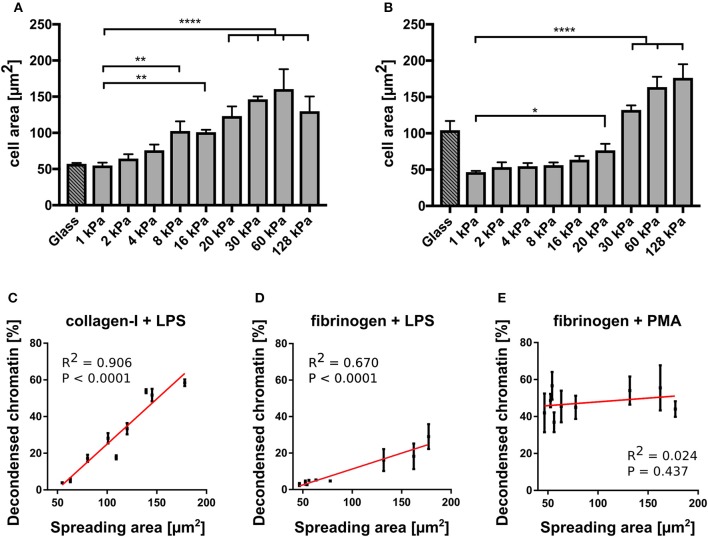
Figure 4.
NETosis correlates with cell spreading area. (A) Cell spreading area increases with increasing stiffness on collagen I-coated PAA gels. (B) Cell spreading area increases with increasing stiffness on fibrinogen-coated PAA gels. LPS-stimulated NETosis correlates with spreading area on PAA gels of different stiffness coated with collagen (C) and fibrinogen (D). (E) PMA stimulation does not depend on spreading area. The red lines indicate linear fits. R2 and P-values (indicating likelihood of slope being non-zero) are shown in the graph for each condition (C). n > 500 cells for each condition. N = 3 donors. Mean ± SEM of independent donors. Statistics: one-way ANOVA (Bonferroni's multiple comparisons test. *p < 0.05; **p < 0.01; ****p < 0.0001; ns: not significant).

