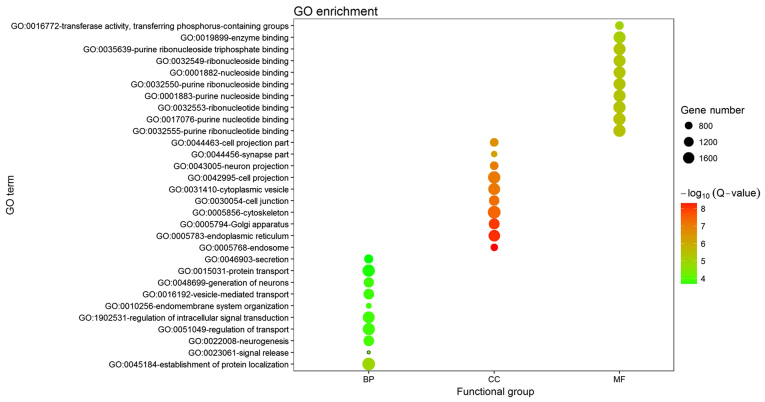
Figure 2.
Visualization of GO enrichment for the predicted targets of the DEGs in CRSwNP. The detailed GO enrichment information is presented in a bubble diagram. The Y-axis represents the GO terms and the X-axis represents the categories BP, CC and MF. The number of genes enriched in a GO term is represented by the size of the node. The significance of the GO terms is represented by the colour, with red indicating the highest significance. GO, gene ontology; BP, biological process; CC, cellular component; MF, molecular function.

