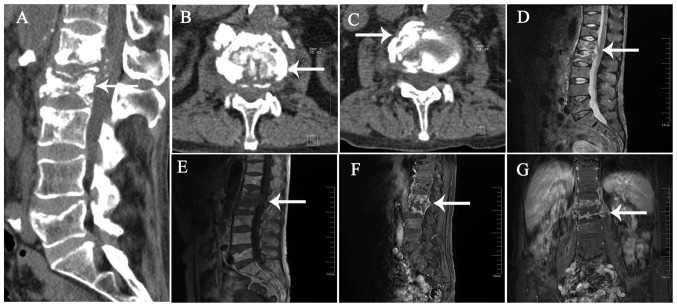
Figure 4.
CT and MRI images of the lumbar vertebral body in a 54 year-old female patient on June 26, 2017. The patient did not receive any treatment after examination. (A) In the sagittal plane on CT, the destruction of the vertebral body and local bone sclerosis were apparent, and the vertebral body was highly compressed. (B) Cross-sectional view of the vertebral body revealing bone destruction and compression of local dura in the transverse plane. (C) CT cross-sectional view indicates partial necrosis of the vertebral body in the transverse plane. (D-G) MRI (visual field, 40×40×40 cm; layer thickness, 5 mm; layer spacing, 3 mm; b, 800 sec/mm2). (D) Patchy long T1 signal of the L1 and L2 vertebral body in the sagittal plane, (E) patchy long T2 signal of the L1 and L2 vertebral body in the sagittal plane and (F) high short T inversion recovery signal of the L1 and L2 vertebral body in the sagittal plane. Heterogeneous signal changes in multiple vertebrae and a paravertebral abscess, with intervertebral disc involvement were observed. (G) Contrast-enhanced MRI revealed intervertebral disc involvement in the coronal plane. Small grid, 1 cm. The lesion is indicated by white arrows. CT, computed tomography; MRI, magnetic resonance imaging.

