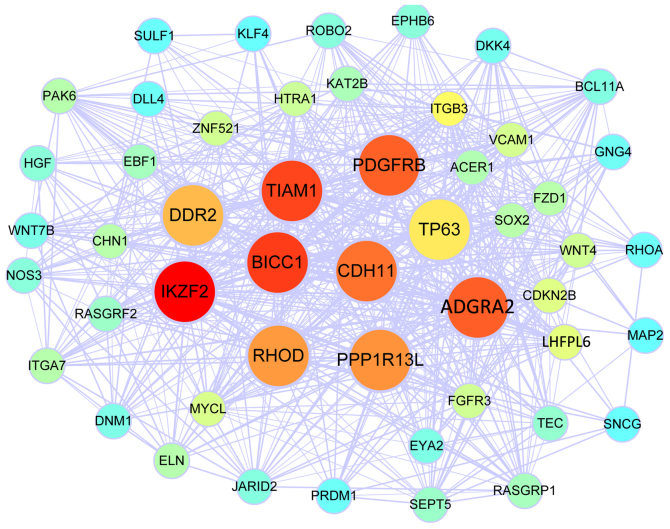
Figure 2.
Co-expression network of the turquoise module identified by WGCNA. The colour spectrum illustrates the degree of connectivity of the nodes, with red indicating the highest degree of connectivity and turquoise the lowest degree of connectivity. The nodes with a larger size represent hub genes among the top 10 with the highest network connectivity degree. WGCNA, Weighted Gene Co-Expression Network Analysis.

