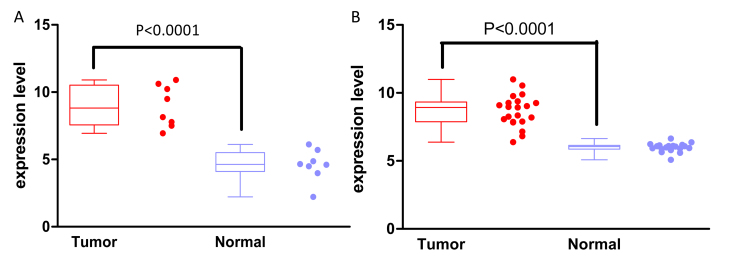
Figure 4.
Validation of differential expression of METTL7B in EAC. (A) Expression level of METTL7B in EAC (n=8) and normal epithelium tissues (n=8) based on data from The Cancer Genome Atlas. (B) Expression level of METTL7B in EAC (n=21) and normal epithelium tissues (n=19) based on data from the microarray dataset GSE26886. In the box plot, the boxes indicate the median and interquartile range of data, while the error bars represent the minimum and maximum values. The data points display the exact numerical expression level for each sample. EAC, esophageal adenocarcinoma; METTL7B, methyltransferase like 7B.

