Figure 1.
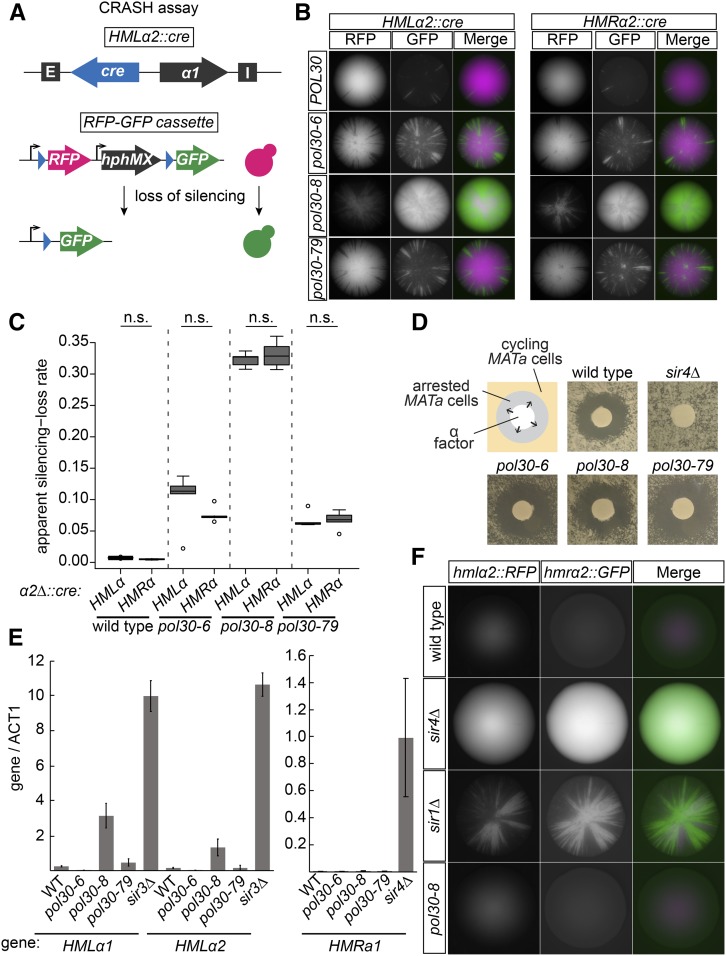
Mutants of POL30 caused transient loss of silencing. (A) Schematic of the CRASH loss-of-silencing assay. Expression of cre from HMLα2::cre occurs when transcriptional silencing is disturbed. In cells that lose silencing even transiently, Cre causes a permanent switch from expressing RFP to expressing GFP. In a similar strain, cre is expressed from HMRα2 to detect loss-of-silencing events at HMR. (B) Colonies of HMLα2::cre (left panel) and HMRα2::cre (right panel) strains for each POL30 allele. Each green sector represents a loss-of-silencing event. Wild-type strains (JRY10790, left and JRY10710, right) had few sectors. Strains containing pol30-6 (JRY11137, left and JRY11186, right), pol30-8 (JRY11188, left and JRY11187, right), or pol30-79 (JRY11141, left and JRY11608, right) had elevated sectoring compared to wild type. (C) The apparent silencing-loss rates for each of the strains in B were quantified by flow cytometry as described in Materials and Methods and in Janke et al. (2018). Significance (Nonsignificant difference = n.s.) was determined by one-way ANOVA and Tukey’s honestly significant difference post hoc test. The center line of each box plot represents the median of at least five biological replicates. The boxes represent the 25th and 75th percentiles. Whiskers represent the range of values within 1.5× the interquartile range. Values extending past 1.5× the interquartile range are marked as outliers (circles). (D) α-Factor halo assay. Filter papers soaked in the mating pheromone α-factor (200 μM in 100 mM sodium acetate) were placed onto a freshly spread lawn of MATa cells of each indicated genotype. MATa cells that maintain silencing at HMLα will arrest in G1 phase around the filter paper, creating a “halo.” Cells that heritably lose silencing at HMLα do not arrest in response to α-factor. Representative images of wild type (JRY4012), sir4Δ (JRY4577), pol30-6 (JRY11645), pol30-8 (JRY11647), and pol30-79 (JRY11649) are shown. (E) Quantitative RT-PCR of α 1 and α2 transcripts from HMLα and a1 from HMRa. Quantification was performed using a standard curve for each set of primers and normalized to ACT1 transcript levels. Error bars represent SD. Bars represent the normalized average of three technical replicates of each indicated strain: WT (JRY11699 matΔ), sir3Δ (JRY9624, matΔhmrΔ) sir4Δ (JRY12174 MATα), pol30-6 (JRY11700 mat Δ), pol30-8 (JRY11701 matΔ), and pol30-79 (JRY11702 matΔ). (F) Genes encoding fluorescence reporters were placed at HMLα2 (RFP) and HMRα2 (GFP) to report on transcription from the two loci. Shown are representative images of colonies from each strain: WT (JRY11129), sir4Δ (JRY11131), sir1Δ (JRY11130) pol30-8 (JRY11132). WT, wild type.

