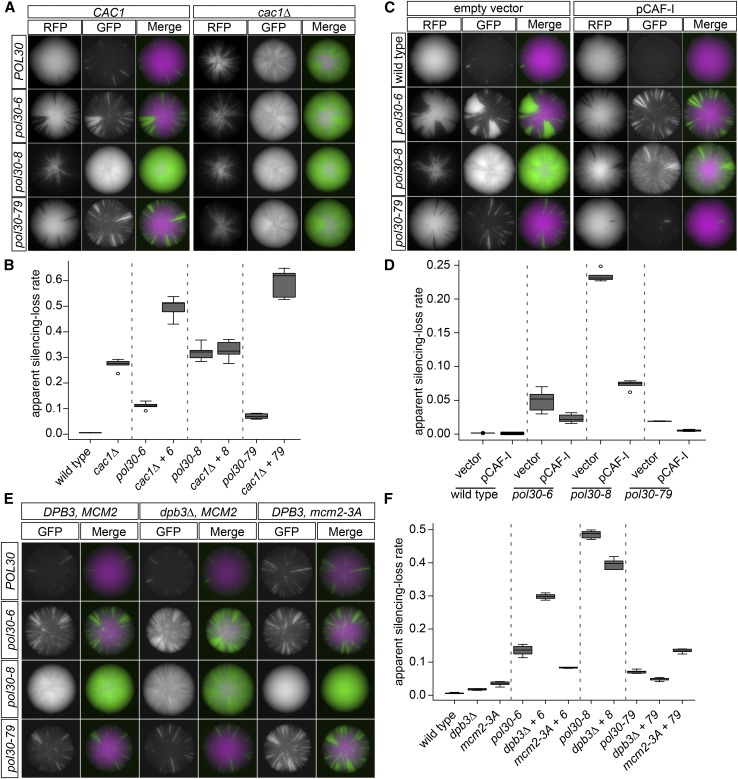
Figure 6.
Coordination of histone chaperones by PCNA was required for transcriptional silencing. (A) Double-mutant analysis of POL30 alleles with cac1Δ. Representative images of CRASH colonies. The left panel shows colonies with each of the POL30 alleles with wild-type CAC1 strain: POL30 (JRY10790), pol30-6 (JRY11137), pol30-8 (JRY11188), and pol30-79 (JRY11141). The right panel shows colonies with each of the POL30 alleles in combination with deletion of CAC1 (cac1 Δ): POL30 cac1Δ (JRY11193), pol30-6 cac1Δ (JRY11192), pol30-8 cac1Δ (JRY11189), and pol30-79 cac1Δ (JRY11163). (B) The apparent silencing-loss rates for each of the strains in A were quantified by flow cytometry as described in Figure 1C. (C) Overexpression of the CAF-1 complex in combination with POL30 alleles. Representative images of CRASH colonies. The left panel shows colonies with each of the POL30 alleles in combination with a 2μ vector (pRS425): POL30 (JRY11175), pol30-6 (JRY11176), pol30-8 (JRY11177), and pol30-79 (JRY11178). The right panel shows colonies with each of the POL30 alleles in combination with a 2μ plasmid expressing all three subunits of the CAF-1 complex, CAC1, CAC2, and CAC3 (pJR3418): POL30 pCAF-1 (JRY11165), pol30-6 pCAF-1 (JRY11166), pol30-8 pCAF-1 (JRY11167), and pol30-79 pCAF-1 (JRY11168). (D) The apparent silencing-loss rates for each of the strains in C were quantified by flow cytometry as described in Figure 1C. (E) Double-mutant analysis of POL30 alleles with dpb3Δ and mcm2-3A alleles. Representative images of CRASH colonies. In the left panel are each of the POL30 alleles in a wild-type strain: POL30 (JRY10790), pol30-6 (JRY11137), pol30-8 (JRY11188), and pol30-79 (JRY11141). In the middle panel are each of the POL30 alleles in combination with deletion of DPB3 (dpb3Δ): POL30 dpb3Δ (JRY11760), pol30-6 dpb3Δ (JRY11806), pol30-8 dpb3Δ (JRY11808), and pol30-79 dpb3Δ (JRY11810). In the right panel are each of the POL30 alleles in combination with the mcm2-3A allele: POL30 mcm2-3A (JRY11812), pol30-6 mcm2-3A (JRY11987), pol30-8 mcm2-3A (JRY11989), and pol30-79 mcm2-3A (JRY11991). (F) The apparent silencing-loss rates for each of the strains in E were quantified by flow cytometry as described in Figure 1C. The silencing-loss rate for pol30-8 mcm2-3A double mutant could not be quantified because it uniformly expressed GFP.

