Figure 4.
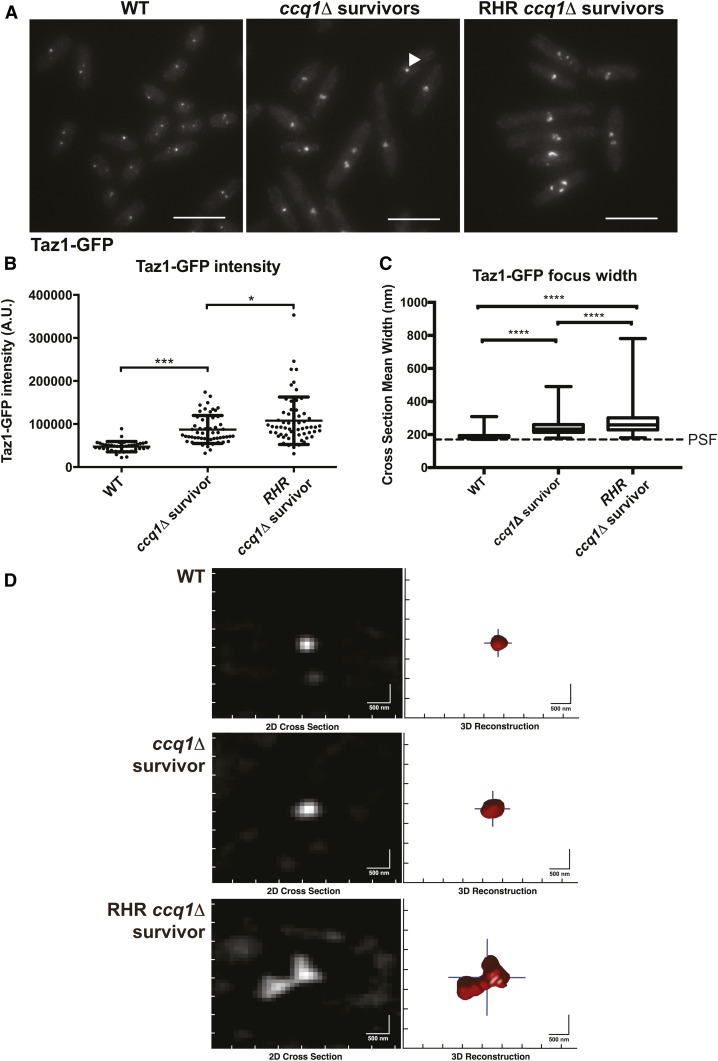
ccq1Δ survivors that form after constitutive Rnh201 overexpression display increased Taz1-GFP recruitment and have telomeres that appear larger and declustered. (A) Fluorescence imaging of Taz1-GFP reveals changes in telomere appearance in ccq1Δ Taz1-GFP survivors and RHR ccq1Δ Taz1-GFP survivor cells. Maximum intensity projections of fluorescence micrographs of WT Taz1-GFP, ccq1Δ Taz1-GFP survivors or RHR ccq1Δ Taz1-GFP survivor cells obtained as described in the Materials and Methods. Bar, 10 μm. (B) The intensity of focal Taz1-GFP increases in ccq1Δ survivors, and is further enhanced in RHR ccq1Δ survivors. Measurement is the sum intensity of all Taz1-GFP foci. n > 50 cells for each genotype. * P < 0.05, *** P < 0.001 by Student’s t-test corrected for multiple comparisons. (C) Taz1-GFP foci were reconstructed using an algorithm previously developed by our group (see Materials and Methods) on Z-stacks obtained as in (A). The mean cross-section width was determined for each focus; for foci with a cross-section smaller then the point spread function (PSF), the focus will appear with the dimensions of the PSF. Reconstructed WT Taz1-GFP foci (n = 352) are nearly all the size of the PSF (170 nm, dashed line) or smaller. While ccq1Δ survivors display slightly larger Taz1-GFP foci (n = 252), the largest Taz1-GFP foci are seen in the RHR ccq1Δ survivors (n = 132). The box represents the 25th and 75th quartiles, the mean is the black line, and the whiskers include all data. **** P < 0.0001 by Student’s t-test corrected for multiple comparisons. (D) Representative examples of reconstructed Taz1-GFP foci in the three genetic backgrounds. The raw image is on the left, and the telomeric focus is reconstructed on the right. Bar, 500 nm.

