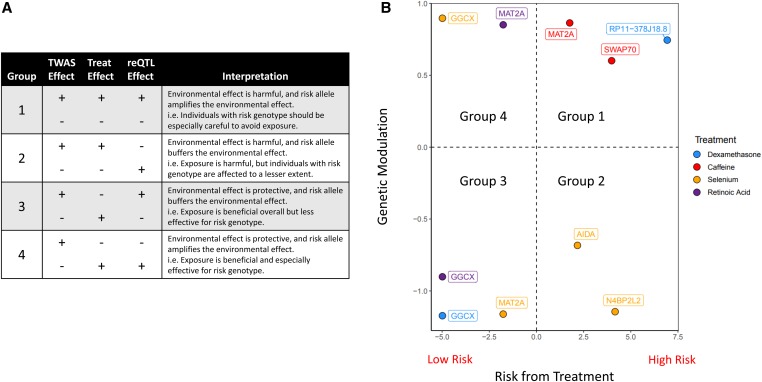
Figure 6.
reQTLs modulate environmental effects on complex traits. (A) Table relating TWAS, gene expression, and reQTL effects. (B) Risk associated with treatment vs. genetic modulation by reQTLs. The risk associated with treatment represents the TWAS effect multiplied by the sign of the logFC of the treatment. Positive values indicate that the treatment amplifies CAD risk. Genetic modulation represents the reQTL effect multiplied by the sign of the logFC of the treatment. Positive values indicate that the risk allele amplifies the treatment effect.

