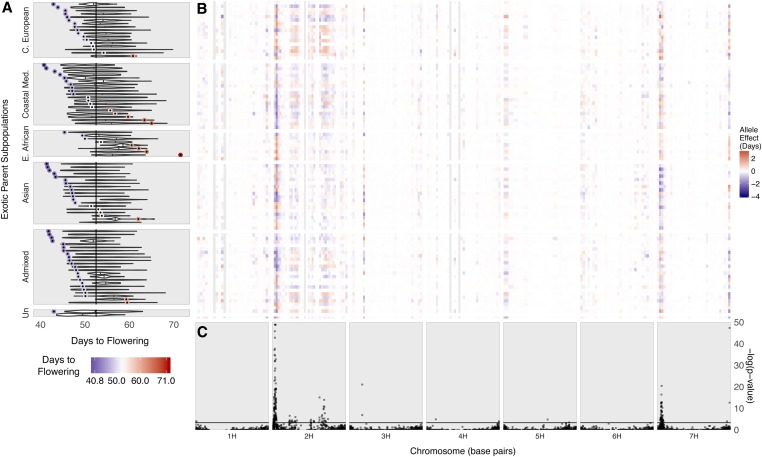
Figure 3.
BRIDG6 population flowering time and allele effects across the genome. (A) Phenotypic distribution of days to flowering (DTF) in the BRIDG6 parents and population. The vertical line is the average DTF for the common parent, Rasmusson. Each donor parent DTF is plotted colored from early (blue) to late (red). Corresponding family DTF BLUPs are plotted as a violin plot. Families (Y-axis) are sorted by donor parent subpopulation and then from earliest DTF (top) to latest DTF (bottom) of the donor parent. (B) Additive effect estimates of alleles contributed by each donor parent for flowering time. Allele effect estimates for each family (Y-axis) are in days relative to the common parent, Rasmusson. For clarity, allele effect estimates are binned over 20 Mbp on each chromosome (X-axis) and the largest allele effect within each bin is plotted. The legend increments are colored from earlier (blue) to later (red). Effect color is centered around zero (white) for the reference allele. Gray regions across families indicate gaps between SNPs >20 Mbp. (C) Marker-trait associations for flowering time. Nested association mapping was conducted across 88 families using 7773 GBS SNPs. All QTL are represented by at least 1 significant marker, but 15 markers with –log(P-value) >50 on chromosome 2H not shown. The horizontal line indicates the 0.05 false discovery rate significance threshold = 3.308.

